Central role of defective interleukin-2 production in the triggering of islet autoimmune destruction - PubMed (original) (raw)
Central role of defective interleukin-2 production in the triggering of islet autoimmune destruction
Qizhi Tang et al. Immunity. 2008 May.
Abstract
The dynamics of CD4(+) effector T cells (Teff cells) and CD4(+)Foxp3(+) regulatory T cells (Treg cells) during diabetes progression in nonobese diabetic mice was investigated to determine whether an imbalance of Treg cells and Teff cells contributes to the development of type 1 diabetes. Our results demonstrated a progressive decrease in the Treg cell:Teff cell ratio in inflamed islets but not in pancreatic lymph nodes. Intra-islet Treg cells expressed reduced amounts of CD25 and Bcl-2, suggesting that their decline was due to increased apoptosis. Additionally, administration of low-dose interleukin-2 (IL-2) promoted Treg cell survival and protected mice from developing diabetes. Together, these results suggest intra-islet Treg cell dysfunction secondary to defective IL-2 production is a root cause of the progressive breakdown of self-tolerance and the development of diabetes in nonobese diabetic mice.
Figures
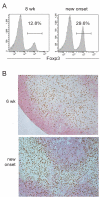
Figure 1. Preserved Treg:Teff balance in PLN during T1D progression
(A.) Flow-cytometric analysis of the percentage of Foxp3+ cells in the total CD4+ T cell population of the PLN of NOD mice. Representative histograms from an 8 week old prediabetic and a new-onset diabetic NOD are shown. (B.) Immunohistochemistry of Foxp3 (brown) and B200 (pink) expression in the PLN of 6-week old and new onset diabetic NOD mice. Data represents five independent experiments with total of 10-12 mice from each disease group.
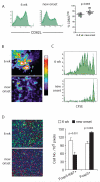
Figure 2. Preservation of Treg cell functions and reduced Teff cell priming in the PLN at the time of disease onset
(A.) Flow cytometric analysis of CD62L expression on CD4+ Foxp3+ cells in the PLN of 6-week old and new-onset diabetic NOD mice. The graph on the right is a summary of four independent experiments comparing CD62L expression on CD4+CD25+ cells in pancreatic LN of young prediabetic (n=9) and newly diabetic (n=11) female NOD mice. (B.) CD4+CD62L+CD25- cells from BDC2.5 T cell receptor transgenic mice were purified by FACS, labeled with CFSE and transferred to 6-week old NOD mice and to mice within three days of diabetes onset. The movement dynamics of transferred Treg cells in explanted PLN were monitored using two-photon laser scanning microscopy. The normalized average CFSE fluorescent intensity over a 30-minute imaging period is illustrated in the “heat maps” shown. The large aggregates of strong fluorescent intensity represented by the yellow-red-white colors indicates restricted movement of cell clusters due to antigen recognition and the lower intensity represented by the blue-purple-black colors indicates random movement in the absence of antigen recognition. (C.) In Vivo Proliferation of transferred CD4+CD62L+CD25- cells from a BDC2.5 T cell receptor transgenic mice in PLN of 6-week old or new-onset diabetic mice were determined by CFSE dilution assay. Two representative histograms are shown. (D.) Proliferation of endogenous T cells in the PLN of 6-week-old and new-onset diabetic NOD mice was determined by co-staining PLN sections for the mitotic marker Ki67 (green), anti-CD4 (blue), and anti-Foxp3 (red). Representative micrographs are shown (left) and the average numbers of Foxp3+ cells and Foxp3- Ki67+ cells in three randomly selected objective fields in the T cell zones of the PLN are summarized (right, mean±sd, n=3 mice). Results in each panel represent two to four independent experiments.
Figure 3. Dynamics of Teff and Treg cells in the islets of NOD mice during diabetes progression
(A.) Numbers of CD4+ and Foxp3+ cells in individual islets were quantified by manual counting of frozen pancreatic sections strained with immunofluorescent labled antibodies. The percentages of Foxp3+ Treg cells among CD4+ T cells in individual islet sections are plotted against the total numbers of CD4+ cells in the corresponding islet sections. Correlation analysis revealed a significant inverse correlation (Spearman r = - 0.707) between the numbers of total CD4+ T cells per islet section and percentage of Treg cells in the corresponding islet (p<0.0001). (B.) Numbers of Ki67+CD4+Foxp3-, Ki67-CD4+Foxp3-, Ki67+CD4+Foxp3+, and Ki67-CD4+Foxp3+ cells in individual islets were quantified as described in A. Percentages of proliferating (Ki67+) Treg cells vs. proliferating Teff cells in islets were calculated and plotted. For both panels, blue symbols represent islets from 6-8 week old NOD mice, green symbols are from 10-12 week old mice and red symbols are from mice with recent diabetes onset.
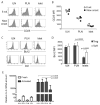
Figure 4. Loss of CD25 and Bcl-2 expression on intra-islet Treg cells
(A and B.) Flow cytometric analyses of CD25 expression on CD4+Foxp3+ cells. Representative CD25 versus Foxp3 dot plots of CD4+ cells in ILN, PLN and islets and are shown (A) along with a graph summarizing the the mean fluorescent intensities of CD25 on CD4+Foxp3+ cells (B). The open symbols represent 8 week old mice and filled symbols represent mice with recent diabetes onset. Results are representative of four independent experiments. (C and D.) Flow cytometric analysis of Bcl-2 expression in CD4+Foxp3+ cells. Representative Bcl-2 (top) and isotype control staining (bottom) histograms of CD4+Foxp3+ cells in ILN, PLN, and islets are shown (C) along with a bar graph summarizing the mean fluorescent intensities of Bcl-2 expression in CD4+Foxp3+ cells (D, mean±sd, n=4). Results are representative of five independent experiments. (E.) real-time RT-PCR analysis of IL-2 mRNA in various lymphoid organs and islets. Tissue samples from prediabetic NOD female mice were assayed individually (mean±sd, n=4). Student t test was performed to determine the statistical significance of the difference and p values for the significantly different sample pairs are shown on the graph.
Figure 5. Effect of high dose IL-2 treatment on prediabetic NOD mice
A cohort of 10-week old female NOD mice were treated with daily intra-peritoneal injections of 5 μg IL-2 and 50 μg of anti-IL-2 complex or irrelevant rat IgG as control for five consecutive days (n=3/condition). One week after the initiation of the treatment, the composition of the spleen, PLN and intra-islet infiltrates were analyzed by flow cytometry. (A.) Dot plots displaying Foxp3 and CD25 expression on CD4+ cells in control- (Top) and IL-2 complex-(bottom) treated mice. (B) Bar graphs summarizing the frequency of Treg cells and (C) CD25hiFoxp3- Teff cells among CD4+ cells, (D) CD25hi cells among CD8+ cells and (E) percentage of NK cells among all CD45+ leukocytes are shown (mean±sd, n=3). The differences between control and IL-2 treated samples in panels B through E in all organs analyzed are significant (p<0.05) by student t test analysis. Results are representative of three independent experiments. (F.) A separate cohort of 10-week old female NOD mice were treated with control rat IgG or IL-2 complex as in A (n=10/group). The outcome one week after the treatment is summarized. Result represents three separate experiments.
Figure 6. Low dose IL-2 therapy restores Treg:Teff balance
A cohort of ten week-old female NOD mice were treated with daily injections of 0.5 μg IL-2 and 5 μg anti-IL-2 complex or irrelevant rat IgG as control for five consecutive days. Expression of (A) CD25 and (B and C) Bcl-2 on Treg cells in PLN and islets were determined by flow cytometry. Percentages of (D) Treg cells, (E) Foxp-CD25hi CD4+ Teff cells, (F) CD25hi CD8+ Teff cells, and (G) NK cells are summarized (mean±sd, n=5 for panel C, D, and G; n=3 for panels E and F). P-values for the samples that showed significant differences between control and IL-2 treated mice are indicated in the graphs, and all others were not significantly different by student t test (p>0.05). Results are representative of at least three independent experiments.
Figure 7. Low dose IL-2 therapy prevents diabetes
Diabetes progression in NOD mice treated with (A) 0.5 μg IL-2 and 5 μg anti-IL-2 complex or (B) recombinant human IL-2. Control mice received saline. Shaded areas inside the graphs indicate the duration of the treatments, between 10-20 weeks for A and between 5 and 20 for B. P-values between the control and the IL-2-treated groups are 0.0002 for experiment depicted in A and 0.11 for experiment in B. (C.) Severity of intra-islet infiltration in mice that remain free of overt diabetes at the end of the experiment in B was evaluated histologically and the percentage of islets with no infiltration (0), peri-insulitis (1), moderate insulitis with less than 50% islet area infiltrated (2), and severe insulitis with greater than 50% islet area infiltrated (3) were determined and plotted. Data for the Saline group represents 40 islets from 4 mice and data from IL-2 treatment group represents 341 islets from 8 mice.
Comment in
- Regulating Treg cells at sites of inflammation.
Lazarski CA, Hughson A, Sojka DK, Fowell DJ. Lazarski CA, et al. Immunity. 2008 Oct 17;29(4):511; author reply 512. doi: 10.1016/j.immuni.2008.09.012. Immunity. 2008. PMID: 18957259 No abstract available.
Similar articles
- IL-2 promotes the function of memory-like autoregulatory CD8+ T cells but suppresses their development via FoxP3+ Treg cells.
Shameli A, Yamanouchi J, Tsai S, Yang Y, Clemente-Casares X, Moore A, Serra P, Santamaria P. Shameli A, et al. Eur J Immunol. 2013 Feb;43(2):394-403. doi: 10.1002/eji.201242845. Epub 2013 Jan 15. Eur J Immunol. 2013. PMID: 23180662 - Diabetes in non-obese diabetic mice is not associated with quantitative changes in CD4+ CD25+ Foxp3+ regulatory T cells.
Mellanby RJ, Thomas D, Phillips JM, Cooke A. Mellanby RJ, et al. Immunology. 2007 May;121(1):15-28. doi: 10.1111/j.1365-2567.2007.02546.x. Immunology. 2007. PMID: 17428252 Free PMC article. - Th1-Like ICOS+ Foxp3+ Treg Cells Preferentially Express CXCR3 and Home to β-Islets during Pre-Diabetes in BDC2.5 NOD Mice.
Kornete M, Mason ES, Girouard J, Lafferty EI, Qureshi S, Piccirillo CA. Kornete M, et al. PLoS One. 2015 May 6;10(5):e0126311. doi: 10.1371/journal.pone.0126311. eCollection 2015. PLoS One. 2015. PMID: 25946021 Free PMC article. - Restoring Regulatory T Cells in Type 1 Diabetes.
Spence A, Tang Q. Spence A, et al. Curr Diab Rep. 2016 Nov;16(11):110. doi: 10.1007/s11892-016-0807-6. Curr Diab Rep. 2016. PMID: 27664043 Review. - Natural Treg in autoimmune diabetes: all present and correct?
Walker LS. Walker LS. Expert Opin Biol Ther. 2008 Nov;8(11):1691-703. doi: 10.1517/14712598.8.11.1691. Expert Opin Biol Ther. 2008. PMID: 18847305 Review.
Cited by
- Therapeutic regulatory T cells subvert effector T cell function in inflamed islets to halt autoimmune diabetes.
Mahne AE, Klementowicz JE, Chou A, Nguyen V, Tang Q. Mahne AE, et al. J Immunol. 2015 Apr 1;194(7):3147-55. doi: 10.4049/jimmunol.1402739. Epub 2015 Mar 2. J Immunol. 2015. PMID: 25732730 Free PMC article. - Low-dose interleukin-2-loaded nanoparticle effect on NK and T-reg cell expression in experimentally induced type 1 diabetes mellitus.
Aboelnazar S, Ghoneim H, Moaaz M, Bahgat ET, Shalaby T. Aboelnazar S, et al. Prz Gastroenterol. 2021;16(1):67-82. doi: 10.5114/pg.2021.104737. Epub 2021 Mar 26. Prz Gastroenterol. 2021. PMID: 33986891 Free PMC article. - The dysfunction of CD4(+)CD25(+) regulatory T cells contributes to the abortion of mice caused by Toxoplasma gondii excreted-secreted antigens in early pregnancy.
Chen JL, Ge YY, Zhang J, Qiu XY, Qiu JF, Wu JP, Wang Y. Chen JL, et al. PLoS One. 2013 Jul 17;8(7):e69012. doi: 10.1371/journal.pone.0069012. Print 2013. PLoS One. 2013. PMID: 23874852 Free PMC article. - Diabetes, infection risk and COVID-19.
Erener S. Erener S. Mol Metab. 2020 Sep;39:101044. doi: 10.1016/j.molmet.2020.101044. Epub 2020 Jun 23. Mol Metab. 2020. PMID: 32585364 Free PMC article. Review. - Importance of Studying Non-Coding RNA in Children and Adolescents with Type 1 Diabetes.
Cabiati M, Federico G, Del Ry S. Cabiati M, et al. Biomedicines. 2024 Sep 2;12(9):1988. doi: 10.3390/biomedicines12091988. Biomedicines. 2024. PMID: 39335501 Free PMC article. Review.
References
- Aluvihare VR, Betz AG. The role of regulatory T cells in alloantigen tolerance. Immunol Rev. 2006;212:330–343. - PubMed
- Anderson MS, Bluestone JA. The NOD mouse: a model of immune dysregulation. Annu Rev Immunol. 2005;23:447–485. - PubMed
- Arkwright PD, Abinun M, Cant AJ. Autoimmunity in human primary immunodeficiency diseases. Blood. 2002;99:2694–2702. - PubMed
- Belkaid Y, Blank RB, Suffia I. Natural regulatory T cells and parasites: a common quest for host homeostasis. Immunol Rev. 2006;212:287–300. - PubMed
- Belkaid Y, Piccirillo CA, Mendez S, Shevach EM, Sacks DL. CD4+CD25+ regulatory T cells control Leishmania major persistence and immunity. Nature. 2002;420:502–507. - PubMed
Publication types
MeSH terms
Substances
Grants and funding
- P30 DK063720/DK/NIDDK NIH HHS/United States
- P01 AI035297/AI/NIAID NIH HHS/United States
- R37 AI046643/AI/NIAID NIH HHS/United States
- HHMI/Howard Hughes Medical Institute/United States
- T32 AI007090/AI/NIAID NIH HHS/United States
- S10 RR014884/RR/NCRR NIH HHS/United States
- R01 AI050834/AI/NIAID NIH HHS/United States
LinkOut - more resources
Full Text Sources
Other Literature Sources
Medical
Research Materials


