cAMP-dependent signaling as a core component of the mammalian circadian pacemaker - PubMed (original) (raw)
cAMP-dependent signaling as a core component of the mammalian circadian pacemaker
John S O'Neill et al. Science. 2008.
Abstract
The mammalian circadian clockwork is modeled as transcriptional and posttranslational feedback loops, whereby circadian genes are periodically suppressed by their protein products. We show that adenosine 3',5'-monophosphate (cAMP) signaling constitutes an additional, bona fide component of the oscillatory network. cAMP signaling is rhythmic and sustains the transcriptional loop of the suprachiasmatic nucleus, determining canonical pacemaker properties of amplitude, phase, and period. This role is general and is evident in peripheral mammalian tissues and cell lines, which reveals an unanticipated point of circadian regulation in mammals qualitatively different from the existing transcriptional feedback model. We propose that daily activation of cAMP signaling, driven by the transcriptional oscillator, in turn sustains progression of transcriptional rhythms. In this way, clock output constitutes an input to subsequent cycles.
Figures
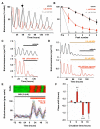
Fig. 1. Dampened and desynchronised cellular circadian gene expression in SCN after suppression of cAMP and CRE rhythms
(A) Circadian oscillation of cAMP concentration (blue) and PER2::LUC bioluminescence (red), and cAMP concentration in SCN slices treated with MDL-12,330A (MDL) or with forskolin plus IBMX. **p<0.01 vs. other samples, ANOVA and post-hoc Duncan’s. (B) Circadian oscillation of CRE activity in two representative SCN slices reported by CRE:luciferase adenovirus. (C) Reversible, dose-dependent suppression of SCN PER2::LUC expression by MDL. Arrows indicate medium changes. (D) Effect of MDL on PER2::LUC expression in individual SCN neurons (n= 20), bioluminescence expressed as relative grey scale (0-255 pixel intensity). Videomicrographs illustrate distribution of PER2::LUC expression before (left) and during (right) treatment with MDL, V= 3rd ventricle, bar= 500μm. (E) Desynchronisation of cellular pacemakers of SCN revealed by (above) raster plots and (below) Rayleigh plots of PER2::LUC oscillations of 20 representative SCN neurons before and after addition of MDL. Data representative of 3 or more slices.
Fig. 2. Influence of effectors of cAMP signalling on SCN circadian pacemaking
(A) Effect of HCN channel blocker ZD7288 (arrowhead) on SCN mPER2:LUC circadian gene expression. (B) Damping of peak bioluminescence in SCN slices treated with vehicle or ZD7288 (Pre= pre-treatment, Mean±SEM, n>4). (C) Brefeldin A suppresses circadian gene expression in PER2::LUC SCN. (D) Transient re-activation of MDL-suppressed circadian PER2::LUC expression in SCN slices by Sp-8-CPT-2′-O-Me-cAMPS. (E) Acute activation of cellular circadian gene expression (expressed as relative grey scale units) by Epac agonist in presence of MDL, illustrated by raster (upper panel) and graphical plots (lower panel) of 20 representative cells. (F) Phase shifts of SCN circadian PER2::LUC bioluminescence rhythm by Epac agonist (Sp-8-CPT-2′-O-Me-cAMP, red) but not vehicle (black, mean±SEM, n>3 per time point, ** p<0.01 vs. vehicle, ANOVA and Bonferroni).
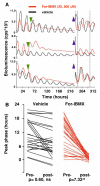
Fig. 3. Alterations in the phase of the SCN oscillator after acute transitions in cAMP concentrations
(A) PER2::LUC bioluminescence rhythms from SCN treated with vehicle or forskolin and IBMX (green arrowhead), followed by washout (blue arrowheads). Dotted lines highlight synchrony of For-IBMX-treated slices, but not control slices, after washout. (B) Phases of PER2::LUC rhythms in individual SCN immediately before (pre-) and four days after (post-) washout of vehicle or For/IBMX. Removal of For-IBMX caused resynchronisation, driving slices to a common phase regardless of phase before washout.
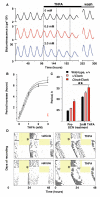
Fig. 4. Prolonged SCN circadian period in vitro and in vivo after inhibition of AC by THFA
(A) Effect of THFA on circadian period of representative SCN slices, reported by mPer1::luciferase (B) Sigmoidal curve fit to one-site inhibition model with 95% confidence limits. Red data point indicates period after washout. (C) Circadian period in SCN from wild-type and Clock mutant mice, before or during treatment with THFA (**p<0.01 vs. pre-treatment, ANOVA and Bonferroni test). All data plotted as mean±SEM, n≥3. (D) Representative double-plotted, wheel-running records of mice treated with (left) vehicle- and (right) THFA (delivered to SCN via osmotic mini-pump). Mice entrained to 12 hours light (shaded) and 12 hours dim red light were released into continuous dim-red. Asterisk indicates day of surgery and commencement of infusion.
Comment in
- Circadian rhythms. Integrating circadian timekeeping with cellular physiology.
Harrisingh MC, Nitabach MN. Harrisingh MC, et al. Science. 2008 May 16;320(5878):879-80. doi: 10.1126/science.1158619. Science. 2008. PMID: 18487177 No abstract available.
Similar articles
- Differential cAMP gating of glutamatergic signaling regulates long-term state changes in the suprachiasmatic circadian clock.
Tischkau SA, Gallman EA, Buchanan GF, Gillette MU. Tischkau SA, et al. J Neurosci. 2000 Oct 15;20(20):7830-7. doi: 10.1523/JNEUROSCI.20-20-07830.2000. J Neurosci. 2000. PMID: 11027248 Free PMC article. - System-driven and oscillator-dependent circadian transcription in mice with a conditionally active liver clock.
Kornmann B, Schaad O, Bujard H, Takahashi JS, Schibler U. Kornmann B, et al. PLoS Biol. 2007 Feb;5(2):e34. doi: 10.1371/journal.pbio.0050034. PLoS Biol. 2007. PMID: 17298173 Free PMC article. - Nucleocytoplasmic shuttling of clock proteins.
Tamanini F, Yagita K, Okamura H, van der Horst GT. Tamanini F, et al. Methods Enzymol. 2005;393:418-35. doi: 10.1016/S0076-6879(05)93020-6. Methods Enzymol. 2005. PMID: 15817303 - [Synchronization and genetic redundancy in circadian clocks].
Dardente H. Dardente H. Med Sci (Paris). 2008 Mar;24(3):270-6. doi: 10.1051/medsci/2008243270. Med Sci (Paris). 2008. PMID: 18334175 Review. French. - Cell "circadian" cycle: new role for mammalian core clock genes.
Borgs L, Beukelaers P, Vandenbosch R, Belachew S, Nguyen L, Malgrange B. Borgs L, et al. Cell Cycle. 2009 Mar 15;8(6):832-7. doi: 10.4161/cc.8.6.7869. Epub 2009 Mar 16. Cell Cycle. 2009. PMID: 19221497 Review.
Cited by
- Vasoactive intestinal peptide produces long-lasting changes in neural activity in the suprachiasmatic nucleus.
Kudo T, Tahara Y, Gamble KL, McMahon DG, Block GD, Colwell CS. Kudo T, et al. J Neurophysiol. 2013 Sep;110(5):1097-106. doi: 10.1152/jn.00114.2013. Epub 2013 Jun 5. J Neurophysiol. 2013. PMID: 23741043 Free PMC article. - BK Channels in the Central Nervous System.
Contet C, Goulding SP, Kuljis DA, Barth AL. Contet C, et al. Int Rev Neurobiol. 2016;128:281-342. doi: 10.1016/bs.irn.2016.04.001. Epub 2016 May 13. Int Rev Neurobiol. 2016. PMID: 27238267 Free PMC article. Review. - Integrated Bulk and Single-Cell RNA-Sequencing Reveals the Effects of Circadian Rhythm Disruption on the Metabolic Reprogramming of CD4+ T Cells in Alzheimer's Disease.
Weng W, Fu J, Cheng F, Wang Y, Zhang J. Weng W, et al. Mol Neurobiol. 2024 Aug;61(8):6013-6030. doi: 10.1007/s12035-023-03907-6. Epub 2024 Jan 24. Mol Neurobiol. 2024. PMID: 38265551 - Regulation of metabolism: the circadian clock dictates the time.
Sahar S, Sassone-Corsi P. Sahar S, et al. Trends Endocrinol Metab. 2012 Jan;23(1):1-8. doi: 10.1016/j.tem.2011.10.005. Epub 2011 Dec 12. Trends Endocrinol Metab. 2012. PMID: 22169754 Free PMC article. Review. - Diurnal variation in vascular and metabolic function in diet-induced obesity: divergence of insulin resistance and loss of clock rhythm.
Prasai MJ, Mughal RS, Wheatcroft SB, Kearney MT, Grant PJ, Scott EM. Prasai MJ, et al. Diabetes. 2013 Jun;62(6):1981-9. doi: 10.2337/db11-1740. Epub 2013 Feb 4. Diabetes. 2013. PMID: 23382450 Free PMC article.
References
- Reppert SM, Weaver DR. Nature. 2002 Aug 29;418:935. - PubMed
- Hastings MH, Reddy AB, Maywood ES. Nat Rev Neurosci. 2003 Aug;4:649. - PubMed
- Ueda HR, et al. Nat Genet. 2005 Feb;37:187. - PubMed
- Hirata H, et al. Science. 2002 Oct 25;298:840. - PubMed
Publication types
MeSH terms
Substances
Grants and funding
- HHMI/Howard Hughes Medical Institute/United States
- MC_U105170643/MRC_/Medical Research Council/United Kingdom
- U.1051.02.004(78799)/MRC_/Medical Research Council/United Kingdom
- BB_/Biotechnology and Biological Sciences Research Council/United Kingdom
LinkOut - more resources
Full Text Sources
Other Literature Sources
Molecular Biology Databases


