Ex vivo dynamic imaging of retinal microglia using time-lapse confocal microscopy - PubMed (original) (raw)
Ex vivo dynamic imaging of retinal microglia using time-lapse confocal microscopy
Jung Eun Lee et al. Invest Ophthalmol Vis Sci. 2008 Sep.
Abstract
Purpose: Retinal microglia have been implicated in the pathogenesis of various retinal diseases, but their basic function and cellular phenotype remain incompletely understood. Here, the authors used a novel ex vivo retinal imaging preparation to examine the behavioral phenotype of living retinal microglia in intact tissue and in response to injury.
Methods: Fluorescence-labeled microglia in retinal explants from CX3CR1(+/GFP) transgenic mice were observed using time-lapse confocal imaging. High spatial and temporal resolution imaging parameters were used to follow dynamic microglial behavior in real time.
Results: Under normal conditions, resting retinal microglia are not static in structure but instead exhibit extensive structural dynamism in their cellular processes. Process movements are highly random in direction but are balanced to maintain overall cellular symmetry and arbor size. At rest, however, these exuberant process movements do not result in overt cellular migration. After focal laser injury, microglial processes increase significantly in their motility and direct themselves toward the injury site. Microglia rapidly transition their morphologies from symmetric to polarized toward the laser lesion. Microglia also transition from a fixed to a migratory phenotype, translocating through tissue while retaining their ramified morphology.
Conclusions: Retinal microglia normally occupying uninjured tissue display a continuous, dynamic behavior that suggests functions of tissue surveillance and intercellular communication. Microglial behavior is highly regulated by, and immediately responsive to, focal tissue injury and may constitute a therapeutic cellular response to focal laser photocoagulation. Ex vivo live imaging in the retina is an experimental approach well suited to the study of dynamic aspects of microglial physiology.
Figures
Figure 1. Distribution of microglia in the retina
(A) Agarose-embedded sections showing distribution of GFP-positive microglia (in green) in CX3CR1+/GFP animals in the inner retina, primarily in the ganglion cell layer (GCL), inner plexiform layer (IPL), and outer plexiform layer (OPL). Nuclei were labeled with DAPI (blue), and vessels with GSIB4 lectin (red) (B) Confocal image from a retinal wholemount explant showing the distribution of ramified, GFPpositive microglia in the outer plexiform layer. (Scale bar = 50 µm) INL = inner nuclear layer, ONL = outer nuclear layer, OS = photoreceptor outer segments.
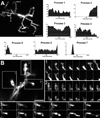
Figure 2. Resting retinal microglia show marked process motility
(A) Microglial cell in a CX3CR1+/GFP mouse retina imaged with time-lapse confocal microscopy. Length-versus-time profiles for each cellular process (indicated by arrows and numbered) demonstrate extension and retraction movements. Scale bar = 50µm. Process 7 was transient with a short half-time (not located on figure) [Supplementary online material, movie S1] (B) High-magnification confocal image of a single microglial process bearing multiple tertiary terminal processes. Image series in insets (taken 10s apart) show progressive structural changes in existing processes, de novo initiation of processes, and complete elimination of existing processes. Scale bar = 5µm. [Supplementary online material, movie S2]
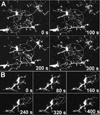
Figure 3. Terminal ends of microglial processes make occasional transient contact with each other
(A) Neighboring microglia progressively extend their processes to meet transiently at a common point (circle) before disengaging and retracting. [Supplementary online material, movie S3] (B) A single cell extends adjacent terminal processes whose tips meet transiently at a single point (circle). [Supplementary online material, movie S4] Scale bar = 20µm.
Figure 4. Distribution of structural changes over the entire microglia cell arbor
Comparison of the area occupied by a microglia cell at one point in time (A) with the area occupied by the same cell over 500s (maximum z-projection of 50 time-lapse images, captured 10s apart (B) demonstrates the ability of dynamic cellular processes to sample a large volume of extracellular space. (C) Subtraction image between confocal images captured at time = 0s and at t = 500s shows that the extent of process additions (in green) are balanced by the extent of process retractions (in red). Scale bar = 20µm.
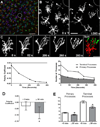
Figure 5. Morphological responses of microglia to focal laser injury
(A) Low magnification (20X) view of microglia in the vicinity of a focal laser burn (dotted circle) with colors representing depth in the Z-direction (purple=superficial and red=deep). Scale bar = 100µm. (B) Higher magnification of microglia at the edge of the laser burn (dotted circle) immediately (left) and 393s after (right) laser injury. Scale bar = 30 µm (C) Cell from inset in (B) showing progressive morphological change in response to laser injury. [Supplementary online material, movie S5] Subtraction image (right) between the initial and final images demonstrate that processes are extended in the direction of the laser burn (in green) and withdrawn on the opposite side of the cell (in red). Scale bar = 20µm. Graph of polarity coefficient vs. time after laser (lower left) demonstrates increasing polarization of the cell towards the laser burn with time. Graph of process number vs. time (lower right) shows decreasing number of primary and terminal processes after laser injury. (D) Polarity coefficients of multiple microglial cells immediately post-laser injury (0 to 5 min) and after a waiting period (30–70 minutes). Error bars indicate 95% confidence intervals. Cells were slightly but not significantly polarized <5 min after injury but became significantly polarized (p < 0.05) after 30 min. (E) Numbers of primary and terminal processes per cell are significantly reduced after 30 minutes post-laser injury (asterisks indicate p <0.05). Analysis of (D) and (E) based on 153 cells from 24 time-lapse recordings in 6 animals.
Figure 6. Dynamic behavior of microglia after focal laser injury
(A) Microglia cell in the vicinity of laser burn (arrow indicates location of laser burn outside image field) soon after laser injury (t = 0s) and approximately 8 minutes afterwards (t = 495s). Subtraction image (right) between these 2 time-points shows displacement of cell body position (dashed and solid circles indicate soma position at 0s and 495s respectively) in addition to a progressive extension of processes towards the laser burn. [Supplementary online material, movie S6] (B) An amoeboid microglia is seen near the laser injury site and migrates across the imaging field. [Supplementary online material, movie S8] Scale bars = 15 µm. (C) Average migration velocity of ramified microglia at different distances from the center of laser injury. The average rates of cellular migration is similar between cells up to 400 microns away from the center of laser injury, but cellular migration decreases significantly with distances greater than 400 microns from the injury site (asterisk indicates p < 0.05). (D) Average velocity of microglia processes after laser injury (n = 363 processes from 99 cells from 12 recordings in 3 animals) increased significantly (p <0.05) compared to that in the resting state (n = 363 processes from 37 cells from 7 recordings in 3 animals).
Similar articles
- Regulation of dynamic behavior of retinal microglia by CX3CR1 signaling.
Liang KJ, Lee JE, Wang YD, Ma W, Fontainhas AM, Fariss RN, Wong WT. Liang KJ, et al. Invest Ophthalmol Vis Sci. 2009 Sep;50(9):4444-51. doi: 10.1167/iovs.08-3357. Epub 2009 May 14. Invest Ophthalmol Vis Sci. 2009. PMID: 19443728 Free PMC article. - Age-related alterations in the dynamic behavior of microglia.
Damani MR, Zhao L, Fontainhas AM, Amaral J, Fariss RN, Wong WT. Damani MR, et al. Aging Cell. 2011 Apr;10(2):263-76. doi: 10.1111/j.1474-9726.2010.00660.x. Epub 2010 Dec 29. Aging Cell. 2011. PMID: 21108733 Free PMC article. - Microglial morphology and dynamic behavior is regulated by ionotropic glutamatergic and GABAergic neurotransmission.
Fontainhas AM, Wang M, Liang KJ, Chen S, Mettu P, Damani M, Fariss RN, Li W, Wong WT. Fontainhas AM, et al. PLoS One. 2011 Jan 25;6(1):e15973. doi: 10.1371/journal.pone.0015973. PLoS One. 2011. PMID: 21283568 Free PMC article. - In vivo dynamics of retinal microglial activation during neurodegeneration: confocal ophthalmoscopic imaging and cell morphometry in mouse glaucoma.
Bosco A, Romero CO, Ambati BK, Vetter ML. Bosco A, et al. J Vis Exp. 2015 May 11;(99):e52731. doi: 10.3791/52731. J Vis Exp. 2015. PMID: 25992962 Free PMC article. - Retinal microglia: Functions and diseases.
Fan W, Huang W, Chen J, Li N, Mao L, Hou S. Fan W, et al. Immunology. 2022 Jul;166(3):268-286. doi: 10.1111/imm.13479. Epub 2022 Apr 22. Immunology. 2022. PMID: 35403700 Review.
Cited by
- In vivo multi-modal imaging of experimental autoimmune uveoretinitis in transgenic reporter mice reveals the dynamic nature of inflammatory changes during disease progression.
Chen X, Kezic JM, Forrester JV, Goldberg GL, Wicks IP, Bernard CC, McMenamin PG. Chen X, et al. J Neuroinflammation. 2015 Jan 27;12:17. doi: 10.1186/s12974-015-0235-6. J Neuroinflammation. 2015. PMID: 25623142 Free PMC article. - Time-lapse Whole-field Fluorescence Imaging of Microglia ProcessesMotility in Acute Mouse Hippocampal Slices and Analysis.
Basilico B, Cortese B, Ratano P, Angelantonio SD, Ragozzino D. Basilico B, et al. Bio Protoc. 2019 Apr 20;9(8):e3220. doi: 10.21769/BioProtoc.3220. eCollection 2019 Apr 20. Bio Protoc. 2019. PMID: 33655009 Free PMC article. - Contribution of microglia-mediated neuroinflammation to retinal degenerative diseases.
Madeira MH, Boia R, Santos PF, Ambrósio AF, Santiago AR. Madeira MH, et al. Mediators Inflamm. 2015;2015:673090. doi: 10.1155/2015/673090. Epub 2015 Mar 22. Mediators Inflamm. 2015. PMID: 25873768 Free PMC article. Review. - Honeycomb-shaped electro-neural interface enables cellular-scale pixels in subretinal prosthesis.
Flores T, Huang T, Bhuckory M, Ho E, Chen Z, Dalal R, Galambos L, Kamins T, Mathieson K, Palanker D. Flores T, et al. Sci Rep. 2019 Jul 23;9(1):10657. doi: 10.1038/s41598-019-47082-y. Sci Rep. 2019. PMID: 31337815 Free PMC article. - The effects of anti-VEGF and kinin B1 receptor blockade on retinal inflammation in laser-induced choroidal neovascularization.
Hachana S, Fontaine O, Sapieha P, Lesk M, Couture R, Vaucher E. Hachana S, et al. Br J Pharmacol. 2020 May;177(9):1949-1966. doi: 10.1111/bph.14962. Epub 2020 Feb 4. Br J Pharmacol. 2020. PMID: 31883121 Free PMC article.
References
- Kreutzberg GW. Microglia: a sensor for pathological events in the CNS. Trends Neurosci. 1996;19:312–318. - PubMed
- Hanisch UK, Kettenmann H. Microglia: active sensor and versatile effector cells in the normal and pathologic brain. Nat Neurosci. 2007;10:1387–1394. - PubMed
- Kim SU, de Vellis J. Microglia in health and disease. J Neurosci Res. 2005;81:302–313. - PubMed
- Block ML, Zecca L, Hong JS. Microglia-mediated neurotoxicity: uncovering the molecular mechanisms. Nat Rev Neurosci. 2007;8:57–69. - PubMed
- Chen L, Yang P, Kijlstra A. Distribution, markers, and functions of retinal microglia. Ocul Immunol Inflamm. 2002;10:27–39. - PubMed
Publication types
MeSH terms
Substances
LinkOut - more resources
Full Text Sources


