Spatial differences in an integral membrane proteome detected in laser capture microdissected samples - PubMed (original) (raw)
. 2008 Jul;7(7):2696-702.
doi: 10.1021/pr700737h. Epub 2008 May 20.
Affiliations
- PMID: 18489132
- PMCID: PMC2740381
- DOI: 10.1021/pr700737h
Spatial differences in an integral membrane proteome detected in laser capture microdissected samples
Zhen Wang et al. J Proteome Res. 2008 Jul.
Abstract
The combination of laser capture microdissection and mass spectrometry represents a powerful technology for studying spatially resolved proteomes. Moreover, the compositions of integral membrane proteomes have rarely been studied in a spatially resolved manner. In this study, ocular lens tissue was carefully dissected by laser capture microdissection and conditions for membrane protein enrichment, trypsin digestion, and mass spectrometry analysis were optimized. Proteomic analysis allowed the identification of 170 proteins, 136 of which were identified with more than one peptide match. Spatial differences in protein expression were observed between cortical and nuclear samples. In addition, the spatial distribution of post-translational modifications to lens membrane proteins, such as the lens major intrinsic protein AQP0, were investigated and regional differences were measured for AQP0 C-terminal phosphorylation and truncation.
Figures
Figure 1
A diagram of a lens that indicates the anterior, equatorial, and posterior sections used for laser capture microdissection. Four regions of the lens, shaded in black, were the captured and subjected to proteomic analysis.
Figure 2
Images of the laser capture microdissected bovine lens anterior cortical tissue. A) H&E stained tissue before LCM, B) optical image of tissue section after laser capture but before tissue removal, C) optical image of tissue section after LCM and tissue removal, and D) optical image of captured tissue on the LCM cap.
Figure 3
Summary of the cellular localization of the identified proteins. 136 proteins identified in the 12 samples were sorted based on the known cellular localization listed in the Swiss-Prot database annotation.
Figure 4
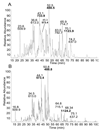
Base peak chromatograms from LC-MS/MS analysis. Base peak chromatogram indicating major AQP0 tryptic peptide signals from: A) anterior cortex laser capture microdissected sample and B) lens homogenate from manually dissected anterior cortex. Major AQP0 and connexin 50 peptides are highlighted in bold font.
Figure 5
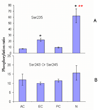
The spatial distribution of AQP0 C-terminal phosphorylation. The relative percentage of phosphorylation in the different regions of the lens are expressed by the ratio of phosphorylation. The ratio of S235 phosphorylation = peak area of phosphorylated 229–238/ peak area of unphosphorylated 234–238; the ratio of phosphorylation on S243 or S245= peak area of mono-phosphorylated 239–259/ peak area of unphosphorylated 239–259. The ratios of phosphorylation are plotted: (A) S235 phosphorylation and (B) S243 or S245 phosphorylation. A single asterisk (*) indicates significance compared to the anterior outer cortex. A double asterisk (**) indicates significance compared to the equator outer cortex (p< 0.01). AC, anterior cortex; EC, equatorial cortex; PC, posterior cortex; N, nucleus.
Figure 6
C-terminal truncation of AQP0 in bovine lens. C-terminal truncation of AQP0 was rarely detected in the outer cortex samples (not shown), but was detected in all of the nucleus samples (gray bars). The relative level of truncation at each site was calculated as the ratio of the peak area of each truncated peptide to the peak area of peptide 239–259.
Similar articles
- Spatial analysis of human lens aquaporin-0 post-translational modifications by MALDI mass spectrometry tissue profiling.
Gutierrez DB, Garland D, Schey KL. Gutierrez DB, et al. Exp Eye Res. 2011 Dec;93(6):912-20. doi: 10.1016/j.exer.2011.10.007. Epub 2011 Oct 25. Exp Eye Res. 2011. PMID: 22036630 Free PMC article. - Post-translational modifications of aquaporin 0 (AQP0) in the normal human lens: spatial and temporal occurrence.
Ball LE, Garland DL, Crouch RK, Schey KL. Ball LE, et al. Biochemistry. 2004 Aug 3;43(30):9856-65. doi: 10.1021/bi0496034. Biochemistry. 2004. PMID: 15274640 - MALDI Imaging Mass Spectrometry Spatially Maps Age-Related Deamidation and Truncation of Human Lens Aquaporin-0.
Wenke JL, Rose KL, Spraggins JM, Schey KL. Wenke JL, et al. Invest Ophthalmol Vis Sci. 2015 Nov;56(12):7398-405. doi: 10.1167/iovs.15-18117. Invest Ophthalmol Vis Sci. 2015. PMID: 26574799 Free PMC article. - Structural function of MIP/aquaporin 0 in the eye lens; genetic defects lead to congenital inherited cataracts.
Chepelinsky AB. Chepelinsky AB. Handb Exp Pharmacol. 2009;(190):265-97. doi: 10.1007/978-3-540-79885-9_14. Handb Exp Pharmacol. 2009. PMID: 19096783 Review. - Merger of laser capture microdissection and mass spectrometry: a window into the amyloid plaque proteome.
Gozal YM, Cheng D, Duong DM, Lah JJ, Levey AI, Peng J. Gozal YM, et al. Methods Enzymol. 2006;412:77-93. doi: 10.1016/S0076-6879(06)12006-6. Methods Enzymol. 2006. PMID: 17046653 Review.
Cited by
- Altered Cell Clusters and Upregulated Aqp1 in Connexin 50 Knockout Lens Epithelium.
Xia CH, Lin W, Li R, Xing X, Shang GJ, Zhang H, Gong X. Xia CH, et al. Invest Ophthalmol Vis Sci. 2024 Sep 3;65(11):27. doi: 10.1167/iovs.65.11.27. Invest Ophthalmol Vis Sci. 2024. PMID: 39287589 Free PMC article. - A predominant form of C-terminally end-cleaved AQP0 functions as an open water channel and an adhesion protein in AQP0ΔC/ΔC mouse lens.
Kumari SS, Varadaraj K. Kumari SS, et al. Biochem Biophys Res Commun. 2019 Apr 9;511(3):626-630. doi: 10.1016/j.bbrc.2019.02.098. Epub 2019 Feb 27. Biochem Biophys Res Commun. 2019. PMID: 30826060 Free PMC article. - Mass spectrometry of membrane proteins: a focus on aquaporins.
Schey KL, Grey AC, Nicklay JJ. Schey KL, et al. Biochemistry. 2013 Jun 4;52(22):3807-17. doi: 10.1021/bi301604j. Epub 2013 Mar 13. Biochemistry. 2013. PMID: 23394619 Free PMC article. Review. - Mapping Glucose Uptake, Transport and Metabolism in the Bovine Lens Cortex.
Zahraei A, Guo G, Varnava KG, Demarais NJ, Donaldson PJ, Grey AC. Zahraei A, et al. Front Physiol. 2022 May 31;13:901407. doi: 10.3389/fphys.2022.901407. eCollection 2022. Front Physiol. 2022. PMID: 35711316 Free PMC article. - Identification and Functional Assessment of Age-Dependent Truncations to Cx46 and Cx50 in the Human Lens.
Slavi N, Wang Z, Harvey L, Schey KL, Srinivas M. Slavi N, et al. Invest Ophthalmol Vis Sci. 2016 Oct 1;57(13):5714-5722. doi: 10.1167/iovs.16-19698. Invest Ophthalmol Vis Sci. 2016. PMID: 27787559 Free PMC article.
References
- Zhou G, Li H, DeCamp D, Chen S, Shu H, Gong Y, Flaig M, Gillespie JW, Hu N, Taylor PR, Emmert-Buck MR, Liotta LA, Petricoin EF, Zhao Y. 2D differential in-gel electrophoresis for the identification of esophageal scans cell cancer-specific protein markers. Mol. Cell. Proteomics. 2002;1:117–124. - PubMed
- Bonner RF, Emmert-Buck M, Cole K, Pohida T, Chuaqui R, Goldstein S, Liotta LA. Laser capture microdissection: molecular analysis of tissue. Science. 1997;278:1481–1483. - PubMed
- Wang HY. Laser capture microdissection in comparative proteomic analysis of hepatocellular carcinoma. Methods Cell Biol. 2007;82:689–707. - PubMed
- Umar A, Luider TM, Foekens JA, Pasa-Tolić L. NanoLC-FT-ICR MS improves proteome coverage attainable for approximately 3000 laser-microdissected breast carcinoma cells. Proteomics. 2007;7:323–329. - PubMed
Publication types
MeSH terms
Substances
LinkOut - more resources
Full Text Sources


