Constitutive CD40 signaling in B cells selectively activates the noncanonical NF-kappaB pathway and promotes lymphomagenesis - PubMed (original) (raw)
Constitutive CD40 signaling in B cells selectively activates the noncanonical NF-kappaB pathway and promotes lymphomagenesis
Cornelia Hömig-Hölzel et al. J Exp Med. 2008.
Abstract
CD40, a member of the tumor necrosis factor (TNF) receptor family, plays an essential role in T cell-dependent immune responses. Because CD40 is widely expressed on the surface of tumor cells in various B cell malignancies, deregulated CD40 signaling has been suggested to contribute to lymphomagenesis. In this study, we show that B cell-specific expression of a constitutively active CD40 receptor, in the form of a latent membrane protein 1 (LMP1)/CD40 chimeric protein, promoted an increase in the number of follicular and marginal zone B cells in secondary lymphoid organs in transgenic mice. The B cells displayed an activated phenotype, prolonged survival and increased proliferation, but were significantly impaired in T cell-dependent immune responses. Constitutive CD40 signaling in B cells induced selective and constitutive activation of the noncanonical NF-kappaB pathway and the mitogen-activated protein kinases Jnk and extracellular signal-regulated kinase. LMP1/CD40-expressing mice older than 12 mo developed B cell lymphomas of mono- or oligoclonal origin at high incidence, thus showing that the interplay of the signaling pathways induced by constitutive CD40 signaling is sufficient to initiate a tumorigenic process, ultimately leading to the development of B cell lymphomas.
Figures
Figure 1.
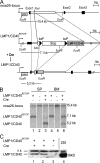
Generation of transgenic mice conditionally expressing LMP1/CD40. (A) Targeting strategy for the insertion of a conditional LMP1/CD40 allele (LMP1/CD40flSTOP) into the murine _rosa26_-locus. Cre-mediated recombination leads to deletion of the stop cassette and expression of LMP1/CD40 under transcriptional control of the endogenous _rosa26_-promoter. The scheme of the targeting construct shows the EcoRI recognition sites and the location of the probe. The expected fragments after EcoRI digestion and hybridization with the labeled probe are indicated by the thin lines. SAS, splice acceptor site; STOP, Stop cassette, XbaI, site of insertion. (B) Southern blot analysis of EcoRI-digested genomic DNA showing the deletion efficiency of the stop cassette in B cells of the spleen (SP; lane 3) and the BM (lane 6) of LMP1/CD40 mice. DNA from B cells of control mice (lanes 2 and 5) and mice heterozygous for LMP1/CD40flSTOP (lane 1 and 4) was included. B cells were purified by using magnetic beads against CD19. After deletion of the stop cassette, the rosa26 probe detects a 5.2-kb fragment (LMP1/CD40). The 15- and 7.1-kb fragments represent the wild-type rosa26 allele (rosa26 locus) and the targeted allele (LMP1/CD40flSTOP), respectively. The deletion efficiency was ∼50% in the BM and almost complete in the spleen. (C) LMP1/CD40 protein expression. Western blots were prepared from spleen lysates of LMP1/CD40;CD19-Cre (lanes 1 and 2) and control mice (lane 3). As control, protein lysates of 293 cells transiently transfected with a LMP1/CD40 expression vector were included in the analysis (lane 4). The 56-kD LMP1/CD40 chimeric protein was detected by an anti–human CD40 antibody. ns, nonspecific band.
Figure 2.
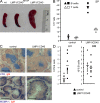
B cell–specific LMP1/CD40 expression results in an increase in B and T cell numbers in secondary lymphoid organs. (A) LMP1/CD40 mice showed a splenomegaly with a 3.5-fold increase of the splenic weight compared with control mice with B cells carrying the stop cassette (LMP1/CD40flSTOP). Representative spleens from 8-wk-old LMP1/CD40 and control mice are shown. (B) Absolute numbers of B220+ B cells and CD3+ T cells in spleen (SP) of LMP1/CD40 and control mice. The horizontal bars mark the mean. (C) Spleen sections from LMP1/CD40 and control mice were stained for B cells (red, anti-IgM) and T cells (top; blue, anti-CD3), or for B cells (red, anti-IgM) and metallophilic macrophages (blue, anti-MOMA1), which are localized at the border between follicular (FO) and marginal zone (MZ) B cells (bottom). Arrowheads indicate marginal zone B cells. Bars, 400 μm. (D) Absolute numbers of B220+ B cells in inguinal LN and BM of LMP1/CD40 and control mice. The horizontal bars mark the mean.
Figure 3.
B cell–specific expression of LMP1/CD40 results in an increase and activation of B cells. (A) Lymphocytes of spleen (SP) and inguinal LNs were analyzed for the expression of IgM and IgD by flow cytometry. Numbers indicate the mean percentages and SD of gated populations. SP: follicular (FO) B cells (IgM+IgD+), marginal zone (MZ), and transitional B cells (IgM+IgDlow); LN: IgM+IgD+. Values were calculated from seven independent experiments. (B) Flow cytometric analysis of follicular B cells (FO; CD21intCD23+) and marginal zone B cells (MZ; CD21highCD23low) in the spleen. Numbers indicate mean percentages and standard deviations of B220+ B cells displaying a MZ B or FO B cell phenotype. Values were calculated from seven independent experiments. (C) Absolute numbers of FO and MZ B cells in the spleens of LMP1/CD40 and control mice. (D) Splenocytes were stained with antibodies specific for the indicated activation and adhesion markers. Histograms show surface expression of the indicated markers on gated B220+ B cells from LMP1/CD40 (continuous line) and control (dotted line) mice. Lymphocytes isolated from LNs showed a similar extent of activation (not depicted).
Figure 4.
LMP1/CD40 expression triggers survival and spontaneous proliferation of primary B cells in vitro. Splenic B cells of LMP1/CD40 and control mice were enriched by depletion of CD43+ cells. Cells were cultured for up to 5 d with anti-CD40 antibody (α-CD40) or without stimulation (w/o). (A) Percentages of living cells (Topro negative) were determined daily by flow cytometry. The bars show mean percentages of living cells of three independent experiments. Error bars show the SD. (B) Numbers of viable cells were determined daily by trypan blue staining and cell counting. The bars show mean cell counts of three independent experiments. Error bars show the SD. (C) Splenic B cells of LMP1/CD40 and control mice were labeled with CFSE and cultured with α-CD40, IL-4, α-CD40 plus IL-4, LPS, or without stimulation (w/o). After 5 d of culture, the proliferation rate of B220+ B cells was determined by flow cytometric analysis of the CFSE staining. Percentages of divided cells ± the SD of three individual experiments are indicated.
Figure 5.
LMP1/CD40 expression induces activity of the Jnk- and Erk-signaling pathways. (A) Whole-cell extracts of splenic B cells of LMP1/CD40 (L/C) and control (co) mice from three independent preparations (1–3) were loaded on one gel and analyzed for Jnk (Jnk2, 54 kD; Jnk1, 46 kD), Erk (Erk1. 44kD; Erk2, 42 kD), p38/MAPK (38 kD) and the corresponding phosphorylated forms with specific antibodies. Equal protein loading was controlled by Ponceau S staining. The graph shows the mean values of the fold induction of the signals from the unphosphorylated and phosphorylated forms of Jnk, Erk, and p38/MAPK compared with the signals in control cells. Mean values and SDs were calculated from at least five independent experiments. SDs are shown by error bars. *, P < 0.05; **, P < 0.001, calculated by the two-tailed Student's t test. (B) After CD40 triggering, LMP1/CD40-expressing cells are damped in activation compared with control cells. Splenic B cells of LMP1/CD40 and control mice were stimulated with α-CD40 antibody for the indicated time points, and Western blots were performed as described in A. Equal protein loading was controlled by tubulin staining. One representative experiment out of three is shown. (C) The improved survival of LMP1/CD40-expressing B cells is dependent on continuous Erk phosphorylation. Splenic B cells of LMP1/CD40 and control mice (CD19-Cre) were cultured for up to 5 d with the Mek1/2 inhibitor U0126 (dotted line) and the Jnk-inhibitor SP600125 (dashed line; triangle and square, respectively). As control, B cells from LMP1/CD40 and control mice were cultured in the presence of DMSO (continuous lines, rectangle, and circle, respectively). Percentages of living cells (Topro negative) were determined by flow cytometry at day 1, 3, and 5. The bars show mean percentages of living cells of three independent experiments. Error bars show the SD.
Figure 6.
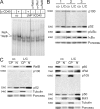
LMP1/CD40 expression induces activity of the noncanonical NF-κB pathway. (A) Splenic B cells of LMP1/CD40 and control (co) mice were cultured with (+) or without (−) α-CD40 for 1 h. Nuclear extracts were incubated with radioactively labeled DNA oligonucleotides containing a NF-κB binding site and separated by gel electrophoresis. For supershift experiments, the indicated antibodies were added to the extracts. (B) Whole-cell extracts of splenic B cells of LMP1/CD40 and control (CD19-Cre) mice from three independent preparations (1–3) were loaded on one gel and analyzed by immunoblot. The expression levels of p100 and p52 as well as of IκBα and pIκBα are shown. Equal protein loading was verified by Ponceau S staining. (C) Cytoplasmic (CP) and nuclear (N) levels of NF-κB components of splenic B cells from LMP1/CD40 and control (CD19-Cre) mice were analyzed by immunoblot. Purity of cytoplasmic and nuclear extracts was verified by α-tubulin and α-Bcl3 staining, respectively. Equal protein loading was controlled by Ponceau S staining. The experiment was performed three times.
Figure 7.
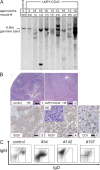
LMP1/CD40 mice develop mono- and oligoclonal lymphomas. (A) Southern blot analysis to examine IgH gene configuration with an IgH-specific probe. Genomic DNA was prepared and digested with EcoRI from splenic cells of LMP1/CD40 mice that developed neoplasias (34, 142, 176, 197, 230, 247, 365, and 221), one young LMP1/CD40 mouse (900; 3 mo of age), as well as a control mouse (905). The sequence analysis of the amplified IgH genes is shown in Fig. S6. (B) Representative histological analyses of diseased LMP1/CD40 mice and age matched control mice. (1) HE-stained normal spleen. (2) HE-stained spleen representative for diseased LMP1/CD40 mice, showing prominent nodular tumor infiltrates. (3) Lymphoma infiltrate within the spleen of a representative diseased LMP1/CD40 mouse. B cells were visualized by immunohistochemistry using an antibody specific for B220. (4) Higher magnification of section described in 3. (5) Dispersed reactive T cells within the lymphoma infiltrate were detected by an anti-CD3–specific antibody. A representative highly magnified section is shown. Bars: (1 and 2) 400 μm; (3) 100 μm; (4, 5, and inset) 25 μm. (C) Flow cytometric analysis of splenic cells for the expression of IgM and IgD. The gates were set according to the age-matched controls. For the diseased LMP1/CD40 mice, a shift toward one or two main populations could be observed, as shown for three representative samples. Fig. S6 is available at
http://www.jem.org/cgi/content/full/jem.20080238/DC1
.
Figure 8.
LMP1/CD40 mice develop lymphomas with a high incidence. Kaplan-Meier curve for lymphoma incidence in LMP1/CD40 and control mice. Lymphomas were scored by histopathology and by investigating mono-/oligoclonality, using Southern blot analysis and/ or PCR amplification of the immunoglobulin genes, followed by sequence analysis. Reduction of the control group between 50 and 80 wk is caused by the analysis of these mice. At each time point, a diseased LMP1/CD40 mouse was analyzed, an age-matched control mouse was included. Dropouts that were caused by nonlymphoma-derived death were equal in both groups. In the age between 12 and 19 mo, 11/19 LMP1/CD40-mice and 1/14 control mice developed tumors, respectively.
Similar articles
- LMP1 signaling can replace CD40 signaling in B cells in vivo and has unique features of inducing class-switch recombination to IgG1.
Rastelli J, Hömig-Hölzel C, Seagal J, Müller W, Hermann AC, Rajewsky K, Zimber-Strobl U. Rastelli J, et al. Blood. 2008 Feb 1;111(3):1448-55. doi: 10.1182/blood-2007-10-117655. Epub 2007 Nov 15. Blood. 2008. PMID: 18006702 - RelB contributes to the survival, migration and lymphomagenesis of B cells with constitutively active CD40 signaling.
Kuhn LB, Valentin S, Stojanovic K, Strobl DC, Babushku T, Wang Y, Rambold U, Scheffler L, Grath S, John-Robbert D, Blum H, Feuchtinger A, Blutke A, Weih F, Kitamura D, Rad R, Strobl LJ, Zimber-Strobl U. Kuhn LB, et al. Front Immunol. 2022 Aug 30;13:913275. doi: 10.3389/fimmu.2022.913275. eCollection 2022. Front Immunol. 2022. PMID: 36110848 Free PMC article. - Molecular mechanisms of TNFR-associated factor 6 (TRAF6) utilization by the oncogenic viral mimic of CD40, latent membrane protein 1 (LMP1).
Arcipowski KM, Stunz LL, Graham JP, Kraus ZJ, Vanden Bush TJ, Bishop GA. Arcipowski KM, et al. J Biol Chem. 2011 Mar 25;286(12):9948-55. doi: 10.1074/jbc.M110.185983. Epub 2011 Jan 24. J Biol Chem. 2011. PMID: 21262968 Free PMC article. - Roles of TRAF6 in CD40 signaling.
Hostager BS. Hostager BS. Immunol Res. 2007;39(1-3):105-14. doi: 10.1007/s12026-007-0082-3. Immunol Res. 2007. PMID: 17917059 Review. - Aberrant NF-kappaB signaling in lymphoma: mechanisms, consequences, and therapeutic implications.
Jost PJ, Ruland J. Jost PJ, et al. Blood. 2007 Apr 1;109(7):2700-7. doi: 10.1182/blood-2006-07-025809. Blood. 2007. PMID: 17119127 Review.
Cited by
- Co-Expression of the Epstein-Barr Virus-Encoded Latent Membrane Proteins and the Pathogenesis of Classic Hodgkin Lymphoma.
Vrzalikova K, Ibrahim M, Nagy E, Vockerodt M, Perry T, Wei W, Woodman C, Murray P. Vrzalikova K, et al. Cancers (Basel). 2018 Aug 24;10(9):285. doi: 10.3390/cancers10090285. Cancers (Basel). 2018. PMID: 30149502 Free PMC article. Review. - Germinal center B cell development has distinctly regulated stages completed by disengagement from T cell help.
Zhang TT, Gonzalez DG, Cote CM, Kerfoot SM, Deng S, Cheng Y, Magari M, Haberman AM. Zhang TT, et al. Elife. 2017 May 12;6:e19552. doi: 10.7554/eLife.19552. Elife. 2017. PMID: 28498098 Free PMC article. - NF-κB as a target for oncogenic viruses.
Sun SC, Cesarman E. Sun SC, et al. Curr Top Microbiol Immunol. 2011;349:197-244. doi: 10.1007/82_2010_108. Curr Top Microbiol Immunol. 2011. PMID: 20845110 Free PMC article. Review. - The ubiquitin modifying enzyme A20 restricts B cell survival and prevents autoimmunity.
Tavares RM, Turer EE, Liu CL, Advincula R, Scapini P, Rhee L, Barrera J, Lowell CA, Utz PJ, Malynn BA, Ma A. Tavares RM, et al. Immunity. 2010 Aug 27;33(2):181-91. doi: 10.1016/j.immuni.2010.07.017. Epub 2010 Aug 12. Immunity. 2010. PMID: 20705491 Free PMC article. - Regulation of p53 and Rb links the alternative NF-κB pathway to EZH2 expression and cell senescence.
Iannetti A, Ledoux AC, Tudhope SJ, Sellier H, Zhao B, Mowla S, Moore A, Hummerich H, Gewurz BE, Cockell SJ, Jat PS, Willmore E, Perkins ND. Iannetti A, et al. PLoS Genet. 2014 Sep 25;10(9):e1004642. doi: 10.1371/journal.pgen.1004642. eCollection 2014 Sep. PLoS Genet. 2014. PMID: 25255445 Free PMC article.
References
- van Kooten, C., and J. Banchereau. 2000. CD40-CD40 ligand. J. Leukoc. Biol. 67:2–17. - PubMed
- DiSanto, J.P., J.Y. Bonnefoy, J.F. Gauchat, A. Fischer, and G. de Saint Basile. 1993. CD40 ligand mutations in x-linked immunodeficiency with hyper-IgM. Nature. 361:541–543. - PubMed
- Korthauer, U., D. Graf, H.W. Mages, F. Briere, M. Padayachee, S. Malcolm, A.G. Ugazio, L.D. Notarangelo, R.J. Levinsky, and R.A. Kroczek. 1993. Defective expression of T-cell CD40 ligand causes X-linked immunodeficiency with hyper-IgM. Nature. 361:539–541. - PubMed
- Kawabe, T., T. Naka, K. Yoshida, T. Tanaka, H. Fujiwara, S. Suematsu, N. Yoshida, T. Kishimoto, and H. Kikutani. 1994. The immune responses in CD40-deficient mice: impaired immunoglobulin class switching and germinal center formation. Immunity. 1:167–178. - PubMed
- Xu, J., T.M. Foy, J.D. Laman, E.A. Elliott, J.J. Dunn, T.J. Waldschmidt, J. Elsemore, R.J. Noelle, and R.A. Flavell. 1994. Mice deficient for the CD40 ligand. Immunity. 1:423–431. - PubMed
Publication types
MeSH terms
Substances
LinkOut - more resources
Full Text Sources
Other Literature Sources
Medical
Molecular Biology Databases
Research Materials


