Lobular and ductal carcinomas of the breast have distinct genomic and expression profiles - PubMed (original) (raw)
. 2008 Sep 11;27(40):5359-72.
doi: 10.1038/onc.2008.158. Epub 2008 May 19.
B Orsetti, V Nègre, P Finetti, C Rougé, J-C Ahomadegbe, F Bibeau, M-C Mathieu, I Treilleux, J Jacquemier, L Ursule, A Martinec, Q Wang, J Bénard, A Puisieux, D Birnbaum, C Theillet
Affiliations
- PMID: 18490921
- PMCID: PMC2902854
- DOI: 10.1038/onc.2008.158
Lobular and ductal carcinomas of the breast have distinct genomic and expression profiles
F Bertucci et al. Oncogene. 2008.
Abstract
Invasive ductal carcinomas (IDCs) and invasive lobular carcinomas (ILCs) are the two major pathological types of breast cancer. Epidemiological and histoclinical data suggest biological differences, but little is known about the molecular alterations involved in ILCs. We undertook a comparative large-scale study by both array-compared genomic hybridization and cDNA microarray of a set of 50 breast tumors (21 classic ILCs and 29 IDCs) selected on homogeneous histoclinical criteria. Results were validated on independent tumor sets, as well as by quantitative RT-PCR. ILCs and IDCs presented differences at both the genomic and expression levels with ILCs being less rearranged and heterogeneous than IDCs. Supervised analysis defined a 75-BACs signature discriminating accurately ILCs from IDCs. Expression profiles identified two subgroups of ILCs: typical ILCs ( approximately 50%), which were homogeneous and displayed a normal-like molecular pattern, and atypical ILCs, more heterogeneous with features intermediate between ILCs and IDCs. Supervised analysis identified a 75-gene expression signature that discriminated ILCs from IDCs, with many genes involved in cell adhesion, motility, apoptosis, protein folding, extracellular matrix and protein phosphorylation. Although ILCs and IDCs share common alterations, our data show that ILCs and IDCs could be distinguished on the basis of their genomic and expression profiles suggesting that they evolve along distinct genetic pathways.
Figures
Figure 1. Frequency of genomic imbalances in IDCs and ILCs and differences according to histological types
Gains and losses were calculated using 0,25 and − 0,25 as log2ratio thresholds. The overall frequency of gains (black) and losses (grey) in the whole training set of 50 tumors was calculated for the 2872 filtered BACs and plotted against their genomic position (Hg18).. A/IDC, B/ILC. The absolute difference corresponding to the subtype specific frequencies was calculated by substracting the frequency of one subtype by the other; C/IDC-ILC, D/ILC-IDC. E/p-values associated to the differences were computed using Wilcoxon two-sample test (CGHtest,
http://www.few.vu.nl/\~mavdwiel/CGHtest.html
). Only significant p-values were represented (p<0.05): we plotted 1-p-value for gains, and −(1-p-value) for losses.
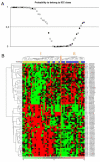
Figure 2. Classification of the training tumor set on the basis of the 75 BACs genomic signature
_A/_The 50 tumors of the training set were classified by SVM and plotted according to their probability to belong to the IDC subclass. A probability > 0.5 signs for IDC, < 0.5 signs for ILC classification. IDCs are indicated by circles and ILCs by triangles. Black circles correspond to IDCs bearing a TP53 mutation, black triangles to ILCs with a CDH1 mutation. _B/_The same 50 tumors were classified using hierarchical clustering based on the the 75 BAC genomic signature. Each column represents a tumor, each row represents a BAC clone. Each cell in the matrix represents the DNA copy number of a BAC clone in a single sample relative to its median abundance across all samples. Red and green indicate levels respectively above and below the median. The magnitude of deviation from the median is represented by the colour saturation. Tumors are separated into two major clusters (I and II). Histological types are shown under the dendrogram: blue boxes indicate ILCs and yellow boxes indicate IDCs.
Figure 3. Global gene expression profiling in lobular and ductal breast cancer
_A/_Hierarchical clustering of 50 samples and 7782 genes/ESTs with significant variation in mRNA expression level across the samples. Representation is as in Figure 3, except that color code represents gene expression level relative to its median abundance across the samples. The dendrogram of samples (above matrixes) represents overall similarities in gene expression profiles and is zoomed in B. Colored bars to the right indicate the locations of 9 gene clusters of interest that are zoomed in B. _B/_Dendrograms of samples and gene clusters. Top, Two large groups of tissue samples (designated I and II), and three subgroups (I, IIa and IIb) are evidenced by clustering and delimited by dashed orange vertical lines. Middle, some relevant features of samples are represented according to a color ladder (unavailable, oblique feature): pathological type (IDC, yellow; ILC, blue), CDH1 IHC status (negative, white; positive, black), and molecular subtype of samples based on the intrinsic gene set (dark blue, luminal A; light blue, luminal B; pink, ERBB2-overexpressing; red, basal; green, normallike; white, not assigned with a correlation inferior to 0.15 with each centroid). Down, expanded view of selected gene clusters named from top to bottom: CDH1 (black bar), luminal/ER (dark blue bar), proliferation (grey bar), ERBB2-related (pink bar), immune (green bar), basal (red bar), adipose (orange bar), early response (light blue bar), stromal (brown bar).
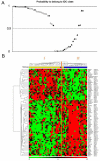
Figure 4. Classification of the training tumor set on the basis of the 75 ESTs/gene expression signature
_A/_and B/Classification of the 50 tumors of the training set. Representation is as in Figures 2A–B.
Figure 5. Validation of cDNA microarray data with quantitative RT-PCR
Boxplots of the expression of 5 genes in IDCs and ILCs (45 tumors from the training set) measured by quantitative RT-PCR. Expression is given in arbitrary units. P-values are strongly significant (t-test). The horizontal black line represents the median expression level.
Similar articles
- Genetic up-regulation and overexpression of PLEKHA7 differentiates invasive lobular carcinomas from invasive ductal carcinomas.
Castellana B, Escuin D, Pérez-Olabarria M, Vázquez T, Muñoz J, Peiró G, Barnadas A, Lerma E. Castellana B, et al. Hum Pathol. 2012 Nov;43(11):1902-9. doi: 10.1016/j.humpath.2012.01.017. Epub 2012 Apr 25. Hum Pathol. 2012. PMID: 22542108 - Different gene expression patterns in invasive lobular and ductal carcinomas of the breast.
Zhao H, Langerød A, Ji Y, Nowels KW, Nesland JM, Tibshirani R, Bukholm IK, Kåresen R, Botstein D, Børresen-Dale AL, Jeffrey SS. Zhao H, et al. Mol Biol Cell. 2004 Jun;15(6):2523-36. doi: 10.1091/mbc.e03-11-0786. Epub 2004 Mar 19. Mol Biol Cell. 2004. PMID: 15034139 Free PMC article. - Molecular and morphologic distinctions between infiltrating ductal and lobular carcinoma of the breast.
Yoder BJ, Wilkinson EJ, Massoll NA. Yoder BJ, et al. Breast J. 2007 Mar-Apr;13(2):172-9. doi: 10.1111/j.1524-4741.2007.00393.x. Breast J. 2007. PMID: 17319859 Review. - Molecular evolutionary patterns in breast cancer.
Shackney SE, Silverman JF. Shackney SE, et al. Adv Anat Pathol. 2003 Sep;10(5):278-90. doi: 10.1097/00125480-200309000-00003. Adv Anat Pathol. 2003. PMID: 12973049 Review.
Cited by
- HER2-positive invasive lobular carcinoma: a rare breast cancer which may not necessarily require anti-HER2 therapy. A population-based study.
Kada Mohammed S, Billa O, Ladoire S, Jankowski C, Desmoulins I, Poillot ML, Coutant C, Beltjens F, Dabakuyo S, Arnould L. Kada Mohammed S, et al. Breast Cancer. 2023 May;30(3):343-353. doi: 10.1007/s12282-022-01432-3. Epub 2023 Jan 30. Breast Cancer. 2023. PMID: 36715845 - Patients with Invasive Lobular Carcinoma Show a Significant Increase in IRS-4 Expression Compared to Infiltrative Ductal Carcinoma-A Histopathological Study.
Ortega MA, Fraile-Martinez O, García-Montero C, Borja-Vergel S, Torres-Carranza D, Pekarek L, Arribas CB, De León-Luis JA, Sánchez-Rojo C, Alvarez-Mon MA, García-Honduvilla N, Buján J, Coca S, Alvarez-Mon M, Saez MA, Guijarro LG. Ortega MA, et al. Medicina (Kaunas). 2022 May 28;58(6):722. doi: 10.3390/medicina58060722. Medicina (Kaunas). 2022. PMID: 35743985 Free PMC article. - Molecular analysis of TCGA breast cancer histologic types.
Thennavan A, Beca F, Xia Y, Recio SG, Allison K, Collins LC, Tse GM, Chen YY, Schnitt SJ, Hoadley KA, Beck A, Perou CM. Thennavan A, et al. Cell Genom. 2021 Dec 8;1(3):100067. doi: 10.1016/j.xgen.2021.100067. Cell Genom. 2021. PMID: 35465400 Free PMC article. - Characterisation of the Stromal Microenvironment in Lobular Breast Cancer.
Gómez-Cuadrado L, Bullock E, Mabruk Z, Zhao H, Souleimanova M, Noer PR, Turnbull AK, Oxvig C, Bertos N, Byron A, Dixon JM, Park M, Haider S, Natrajan R, Sims AH, Brunton VG. Gómez-Cuadrado L, et al. Cancers (Basel). 2022 Feb 11;14(4):904. doi: 10.3390/cancers14040904. Cancers (Basel). 2022. PMID: 35205651 Free PMC article. - Lobular Breast Cancer: Histomorphology and Different Concepts of a Special Spectrum of Tumors.
Christgen M, Cserni G, Floris G, Marchio C, Djerroudi L, Kreipe H, Derksen PWB, Vincent-Salomon A. Christgen M, et al. Cancers (Basel). 2021 Jul 22;13(15):3695. doi: 10.3390/cancers13153695. Cancers (Basel). 2021. PMID: 34359596 Free PMC article. Review.
References
- Bertucci F, Borie N, Ginestier C, Groulet A, Charafe-Jauffret E, Adelaide J, et al. Identification and validation of an ERBB2 gene expression signature in breast cancers. Oncogene. 2004;23:2564–2575. - PubMed
- Bertucci F, Finetti P, Cervera N, Maraninchi D, Viens P, Birnbaum D. Gene expression profiling and clinical outcome in breast cancer. Omics. 2006;10:429–443. - PubMed
- Flagiello D, Gerbault-Seureau M, Sastre-Garau X, Padoy E, Vielh P, Dutrillaux B. Highly recurrent der(1;16)(q10;p10) and other 16q arm alterations in lobular breast cancer. Genes Chromosomes Cancer. 1998;23:300–306. - PubMed
Publication types
MeSH terms
Substances
LinkOut - more resources
Full Text Sources
Other Literature Sources
Medical
Research Materials
Miscellaneous


