Protein Ligation of the Photosynthetic Oxygen-Evolving Center - PubMed (original) (raw)
Protein Ligation of the Photosynthetic Oxygen-Evolving Center
Richard J Debus. Coord Chem Rev. 2008 Feb.
Abstract
Photosynthetic water oxidation is catalyzed by a unique Mn(4)Ca cluster in Photosystem II. The ligation environment of the Mn(4)Ca cluster optimizes the cluster's reactivity at each step in the catalytic cycle and minimizes the release of toxic, partly oxidized intermediates. However, our understanding of the cluster's ligation environment remains incomplete. Although the recent X-ray crystallographic structural models have provided great insight and are consistent with most conclusions of earlier site-directed mutagenesis studies, the ligation environments of the Mn(4)Ca cluster in the two available structural models differ in important respects. Furthermore, while these structural models and the earlier mutagenesis studies agree on the identity of most of the Mn(4)Ca cluster's amino acid ligands, they disagree on the identity of others. This review describes mutant characterizations that have been undertaken to probe the ligation environment of the Mn(4)Ca cluster, some of which have been inspired by the recent X-ray crystallographic structural models. Many of these characterizations have involved Fourier Transform Infrared (FTIR) difference spectroscopy because of the extreme sensitivity of this form of spectroscopy to the dynamic structural changes that occur during an enzyme's catalytic cycle.
Figures
Figure 1
Schematic view of the Mn4Ca cluster and its protein environment as depicted in the 3.0 Å X-ray crystallographic structural model. Distances between Mn (red) and Ca (orange) ions in this model are indicated by the connecting lines (grey, 2.7 Å; blue, 3.3 Å; green, 3.4 Å). Amino acid residues in the first coordination sphere are black; those in the second sphere are grey. Distances are given in Ångstroms. (Reprinted with permission from ref [4], copyright 2005 by Macmillan Publishers Ltd., Nature Publishing Group).
Figure 2
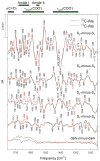
Comparison of the Sn+1-_minus_-Sn FTIR difference spectra of wild-type PSII particles purified from Synechocystis sp. PCC 6803 cells that had been propagated in media containing unlabeled L-alanine (12C, black) or L-[1-13C]alanine (red). The data were collected as described in ref [46] and show the averages of six unlabeled and six L-[1-13C]alanine-labeled samples. The sample temperature was 273 K.
Figure 3
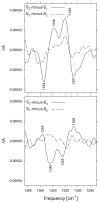
Double difference spectra, 12C-_minus_-13C, obtained by subtracting the Sn+1-_minus_- Sn FTIR difference spectrum of L-[1-13C]alanine-labeled PSII particles from that of unlabeled PSII particles (data from Figure 1). Only the regions between 1385 and 1270 cm−1 are shown. Note that the shift of the νsym(COO −) mode of D1-Ala344 (from 1354 cm − 1 to either 1338 or 1320 cm − 1) that occurs during the S1 → S2 transition is largely reversed during the S3 → S0 transition.
Figure 4
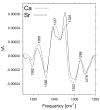
Comparison of the mid-frequency S2-_minus_-S1 FTIR difference spectra of PSII particles purified from Synechocystis sp. PCC 6803 cells that had been propagated in media containing Ca (dashed) or Sr (solid). Each trace represents the average of six samples. The sample temperature was 250 K (modified from ref [32], reprinted with permission, copyright 2005 by the American Chemical Society).
Figure 5
Double difference spectra, 12C-_minus_-13C, of PSII particles containing Ca (dashed) or Sr (solid) obtained by subtracting the S2-_minus_-S1 FTIR difference spectra of L-[1-13C]alanine-labeled PSII particles from the S2-_minus_-S1 FTIR difference spectra of unlabeled PSII particles. Only the regions between 1400 and 1260 cm − 1 are shown (modified from ref [32], reprinted with permission, copyright 2005 by the American Chemical Society).
Figure 6
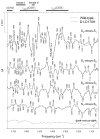
Comparison of the Sn+1-_minus_-Sn FTIR difference spectra of wild-type (dashed) and D1-Asp170His (solid) PSII particles purified from Synechocystis sp. PCC 6803. The spectra have been normalized to maximize overlap. A dark-_minus_-dark control trace of the wild-type PSII particles is included to show the noise level (lower trace). The data (plotted from 1750 cm − 1 to 1050 cm − 1) show the averages of 6 wild-type and 18 D1-Asp170His samples. The sample temperature was 273 K (modified from ref [46], reprinted with permission, copyright 2005 by the American Chemical Society).
Figure 7
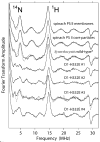
Fourier transforms of normalized two-pulse time domain light-_minus_-dark ESEEM patterns of the S2 state multiline EPR signal of spinach PSII membranes, spinach PSII core particles, Synechocystis wild-type PSII particles, and four independent preparations of Synechocystis D1-His332Glu PSII particles (preparations #1 to #4). For the spinach PSII membranes, the solid and dashed lines correspond to independent preparations that were illuminated at different temperatures. For the spinach PSII core and Synechocystis wild-type PSII particles, the solid and dashed lines correspond to independent sample preparations. For D1-His332Glu PSII preparation #3, the dashed line corresponds to an independent aliquot of the same sample. In the spectrum of the wild-type PSII particles, the ~ 4.8 MHz feature corresponds to nitrogen modulation from a histidyl Mn ligand of the Mn4Ca cluster. Note that the amplitude of this feature is sharply diminished in D1-His332Glu PSII particles, consistent with the Mn ligation by D1-His332. The features at ~ 14.5 and ~ 29 GHz correspond to protons that are weakly coupled to the electron spin of the Mn tetramer (modified from ref [78], reprinted with permission, copyright 2001 by the American Chemical Society).
Figure 8
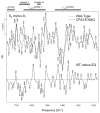
Comparison of the mid-frequency S2-_minus_-S1 FTIR difference spectra (upper traces) of Wild-type (dashed) and CP43-Glu354Gln (solid) PSII particles. The wild-type spectrum represents the average of 10,800 scans. The CP43-Glu354Gln spectrum represents an average of 31,500 scans. The spectra have been normalized to maximize overlap. A wild-type-_minus_-mutant double difference spectrum (lower trace) was calculated by directly subtracting the S2-_minus_-S1 FTIR difference spectra shown in the upper traces. The horizontal dashed line indicates the zero level (reprinted from ref [93]).
Similar articles
- FTIR studies of metal ligands, networks of hydrogen bonds, and water molecules near the active site Mn₄CaO₅ cluster in Photosystem II.
Debus RJ. Debus RJ. Biochim Biophys Acta. 2015 Jan;1847(1):19-34. doi: 10.1016/j.bbabio.2014.07.007. Epub 2014 Jul 16. Biochim Biophys Acta. 2015. PMID: 25038513 Review. - Participation of glutamate-354 of the CP43 polypeptide in the ligation of manganese and the binding of substrate water in photosystem II.
Service RJ, Yano J, McConnell I, Hwang HJ, Niks D, Hille R, Wydrzynski T, Burnap RL, Hillier W, Debus RJ. Service RJ, et al. Biochemistry. 2011 Jan 11;50(1):63-81. doi: 10.1021/bi1015937. Epub 2010 Dec 8. Biochemistry. 2011. PMID: 21114287 Free PMC article. - An evaluation of structural models for the photosynthetic water-oxidizing complex derived from spectroscopic and X-ray diffraction signatures.
Carrell G, Tyryshkin M, Dismukes C. Carrell G, et al. J Biol Inorg Chem. 2002 Jan;7(1-2):2-22. doi: 10.1007/s00775-001-0305-3. Epub 2001 Nov 8. J Biol Inorg Chem. 2002. PMID: 11862536 Review.
Cited by
- Photosystem 2 and the oxygen evolving complex: a brief overview.
Yocum CF. Yocum CF. Photosynth Res. 2022 May;152(2):97-105. doi: 10.1007/s11120-022-00910-1. Epub 2022 Mar 16. Photosynth Res. 2022. PMID: 35294671 Review. - Isotopic labelling of photosystem II in Thermosynechococcus elongatus.
Boussac A, Verbavatz JM, Sugiura M. Boussac A, et al. Photosynth Res. 2008 Oct-Dec;98(1-3):285-92. doi: 10.1007/s11120-008-9305-2. Epub 2008 Apr 19. Photosynth Res. 2008. PMID: 18425598 - Cyanobacterial photosystem II at 2.9-A resolution and the role of quinones, lipids, channels and chloride.
Guskov A, Kern J, Gabdulkhakov A, Broser M, Zouni A, Saenger W. Guskov A, et al. Nat Struct Mol Biol. 2009 Mar;16(3):334-42. doi: 10.1038/nsmb.1559. Epub 2009 Feb 15. Nat Struct Mol Biol. 2009. PMID: 19219048 - Genetically introduced hydrogen bond interactions reveal an asymmetric charge distribution on the radical cation of the special-pair chlorophyll P680.
Nagao R, Yamaguchi M, Nakamura S, Ueoka-Nakanishi H, Noguchi T. Nagao R, et al. J Biol Chem. 2017 May 5;292(18):7474-7486. doi: 10.1074/jbc.M117.781062. Epub 2017 Mar 16. J Biol Chem. 2017. PMID: 28302724 Free PMC article. - Towards characterization of photo-excited electron transfer and catalysis in natural and artificial systems using XFELs.
Alonso-Mori R, Asa K, Bergmann U, Brewster AS, Chatterjee R, Cooper JK, Frei HM, Fuller FD, Goggins E, Gul S, Fukuzawa H, Iablonskyi D, Ibrahim M, Katayama T, Kroll T, Kumagai Y, McClure BA, Messinger J, Motomura K, Nagaya K, Nishiyama T, Saracini C, Sato Y, Sauter NK, Sokaras D, Takanashi T, Togashi T, Ueda K, Weare WW, Weng TC, Yabashi M, Yachandra VK, Young ID, Zouni A, Kern JF, Yano J. Alonso-Mori R, et al. Faraday Discuss. 2016 Dec 16;194:621-638. doi: 10.1039/c6fd00084c. Faraday Discuss. 2016. PMID: 27711803 Free PMC article.
References
- Okamura MY, Satoh Ki, Isaacson RA, Feher G. In: Progress in Photosynthesis Research, Vol. I. Biggins J, editor. Martinus Nijhoff Publishers; Dordrecht: 1987. p. 379.
- Ferreira KN, Iverson TM, Maghlaoui K, Barber J, Iwata S. Science. 2004;303:1831. - PubMed
- Loll B, Kern J, Saenger W, Zouni A, Biesiadka J. Nature. 2005;438:1040. - PubMed
- Tang XS, Diner BA. Biochemistry. 1994;33:4594. - PubMed
LinkOut - more resources
Full Text Sources

