GeneCount: genome-wide calculation of absolute tumor DNA copy numbers from array comparative genomic hybridization data - PubMed (original) (raw)
doi: 10.1186/gb-2008-9-5-r86. Epub 2008 May 23.
Malin Lando, Runar S Brøvig, Debbie H Svendsrud, Morten Johansen, Eivind Galteland, Odd T Brustugun, Leonardo A Meza-Zepeda, Ola Myklebost, Gunnar B Kristensen, Eivind Hovig, Trond Stokke
Affiliations
- PMID: 18500990
- PMCID: PMC2441472
- DOI: 10.1186/gb-2008-9-5-r86
GeneCount: genome-wide calculation of absolute tumor DNA copy numbers from array comparative genomic hybridization data
Heidi Lyng et al. Genome Biol. 2008.
Abstract
Absolute tumor DNA copy numbers can currently be achieved only on a single gene basis by using fluorescence in situ hybridization (FISH). We present GeneCount, a method for genome-wide calculation of absolute copy numbers from clinical array comparative genomic hybridization data. The tumor cell fraction is reliably estimated in the model. Data consistent with FISH results are achieved. We demonstrate significant improvements over existing methods for exploring gene dosages and intratumor copy number heterogeneity in cancers.
Figures
Figure 1
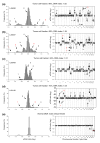
Illustration of the stepwise increase in aCGH ratios with increasing DNA copy number. Frequency histograms (% array probes) of aCGH ratios (left panels) and plot of aCGH ratio versus chromosomal location (right panels) are shown for a lymphoma with a DNA index (DI) of (a) 1.02, (b) 1.94, (c) 1.21, and (d) 1.05, and (e) for normal DNA comparing male and female. The tumor cell fraction, measured by flow cytometry, is indicated for each tumor. DNA copy numbers estimated by GeneCount are marked; those in black were consistent with FISH data, whereas those in red have not been subjected to FISH measurements in the specific tumors shown. The arrows in the right panels point to the locations of the FISH probes. At a DI close to 1 and 2 (a,b,d,e) the ratio distribution shows a major peak at a median log2 value of approximately zero, representing the most frequent DNA copy numbers of 2 and 4, respectively. At a DI of 1.21 (c) the baseline at a log2 ratio of 0 represents a number between 2 and 3 DNA copies. Note the smaller increase in the ratios with increasing DNA copy number at a tumor cell fraction of 70% (d) than of 96% (a). In (e), determination of the dynamic factor, q, as the absolute value of the X-chromosome log2 ratio level is indicated.
Figure 2
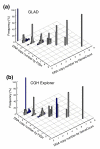
GeneCount calculations with known tumor cell fraction. DNA copy number calculated by GeneCount is plotted against the corresponding FISH result for 9 genes in 94 lymphomas. The smoothed aCGH ratios from (a) GLAD and (b) CGH-explorer, a _q_-value of 0.8, and a DI and tumor cell fraction determined by flow cytometry were inputs to GeneCount. Grey and blue columns represent GeneCount results that were consistent and inconsistent with the FISH data, respectively, after rounding off the GeneCount number to the nearest integer value. Frequency distributions are shown for each copy number, containing 1, 25, 246, 66, 15, 5, 4, and 1 value at a FISH copy number of 0, 1, 2, 3, 4, 5, 6, and 8, respectively.
Figure 3
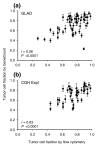
GeneCount estimations of tumor cell fraction. Tumor cell fraction of lymphomas estimated by GeneCount is plotted against tumor cell fraction measured by flow cytometry. Each point represents mean ± standard deviation based on the values achieved for q within the range 0.7-0.9. The smoothed aCGH ratios from (a) GLAD and (b) CGH-explorer, the q range 0.7-0.8, and a DI determined by flow cytometry were inputs to GeneCount. The calculations were based on 55 (a) and 43 (b) tumors for which suitable ratio levels for the calculations existed. Correlation coefficients and _P_-values from Pearson product moment correlation analyses are indicated.
Figure 4
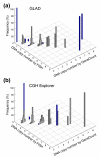
GeneCount estimations with unknown tumor cell fraction. DNA copy number calculated by GeneCount, using a _q_-value within the range 0.7-0.9, a DI determined by flow cytomery, and the tumor cell fraction estimated by GeneCount in Figure 3, is plotted against the corresponding FISH result for 9 genes in (a) 55 and (b) 43 lymphomas. The smoothed array CGH ratio derived from GLAD and CGH-explorer was used in (a) and (b), respectively. Grey and blue columns represent GeneCount results that were consistent and inconsistent with the FISH data, respectively, after rounding off the GeneCount value. Frequency distributions are shown for each copy number, containing 1, 19, 134, 56, 11, 5, 4, and 1 value at a FISH copy number of 0, 1, 2, 3, 4, 5, 6, and 8, respectively, based on GLAD. The corresponding numbers based on CGH Explorer were 1, 15, 98, 48, 7, 5, 4, and 1.
Figure 5
GeneCount estimations in the t(14;18) translocated region involving BCL2. BCL2 copy number estimated by GeneCount, using a _q_-value of 0.8 and a DI and tumor cell fraction determined by flow cytometry, is plotted against the corresponding FISH result in 94 lymphomas. The smoothed array CGH ratios derived from GLAD and CGH-explorer were used in the left and right panels, respectively. Grey and blue columns represent GeneCount calculations that were consistent and inconsistent with the FISH measurements, respectively, after rounding off the GeneCount value. (a) Uncorrected FISH data are plotted; (b) these data were corrected as described in [22]. Frequency distributions are shown for each copy number, containing 1, 38, 33, 13, 5, and 1 value for a red spot FISH copy number of 1, 2, 3, 4, 5, and 6. The corresponding number of measurements for the corrected FISH data of 1, 2, 3, 4, 5, and 6 were 1, 69, 14, 4, 2 and 1.
Figure 6
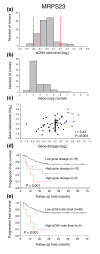
GeneCount analyses in cervical cancers. (a) Frequency histogram (number of tumors) of smoothed aCGH ratios (GLAD) for MRPS23 (BAC clone ID RP11-19F16). Dotted lines indicate the cut off ratio levels of ± 0.2, identifying 5 tumors with genetic gain and 3 tumors with loss. (b) Frequency histogram (number of tumors) of MRPS23 copy number calculated by GeneCount. The GLAD ratio levels, the DI measured by flow cytometry, and the tumor cell fraction estimated by GeneCount were used in the calculation. Similar results were achieved based on the CGH-Explorer ratio levels. (c) Plot of gene expressions against gene dosage; that is, the MRPS23 copy number divided by the total DNA content (N/(2·DI)). Increased gene dosage with more than 15% of the total DNA content (log2 transformed gene dosage of at least 0.2) were seen in 15 tumors (red and blue symbols). Red symbols represent the five tumors with gain in (a), whereas blue symbols represent the remaining ten tumors with increased gene dosage that were not identified in (a). The correlation coefficient and _P_-value from Pearson product moment correlation analysis are indicated. (d) Kaplan Meier analysis based on GeneCount results for MRPS23. Plots of the survival probability are shown for 5 patients with high gene dosage in (c), who also had gain in (a) (red line), 10 patients with high gene dosage in (c) and without gain in (a) (blue line), and 78 patients with low gene dosage in (c). (e) Kaplan Meier analysis based on the MRPS23 ratio levels. The survival probability of 5 patients with gain in (a) (red line) and 88 patients without gain in (a) (black line) is plotted. Only five high risk patients were identified in (e), whereas ten more patients were identified by GeneCount in (d). _P_-value in log-rank test is indicated in (d,e). Panels (a,b,d) are based on 93 tumors, for which the tumor cell fraction could be estimated by GeneCount. Panel (c) is based on 89 of these tumors, for which both DNA copy number and gene expression were available.
Figure 7
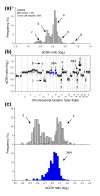
GeneCount identification of DNA copy number heterogeneity within tumors. (a) Frequency histogram (% array probes) of aCGH ratios in a heterogeneous lymphoma, including data for the entire genome. (b) aCGH ratios are plotted against chromosomal location, showing the heterogeneous regions on chromosomes 8, 9, and 17 with a DNA copy number of 3&4 in blue. (c) Frequency histogram (% array probes) of aCGH ratios for two homogeneous DNA regions with a copy number of 3&4 (upper panel) and the heterogeneous region depicted in (b) with a copy number of 3&4 (lower panel). The ratio distributions of copy number 3, 4, and 3&4 were significantly different (p < 0.001, ANOVA). DNA copy numbers estimated by GeneCount from the DI and tumor cell fractions measured by flow cytometry are marked; those in black were consistent with FISH experiments, whereas those in red have not been subjected to FISH measurements in the specific tumors shown. The arrows in (b) point to the locations of the FISH probes. Note that the 3&4 copy number of the heterogeneous region has been confirmed with FISH.
Figure 8
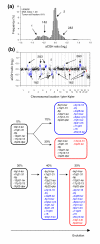
Evolutionary sequences of subpopulations in heterogeneous tumors. (a) Frequency histogram (% array probes) of aCGH ratios in a heterogeneous lymphoma is shown, including data for the entire genome. (b) The aCGH ratios are plotted against chromosomal location. The heterogeneous regions on chromosomes 2q, 5p, 7q, 9p, 13q, 20q, and Xp with a DNA copy number of 1&2 and on chromosomes 2p, 4q, 6p, 11q, and 18 with a DNA copy number of 2&3 are shown in blue and red. The blue and red colors represent aberrations that are present in different fractions of the tumor cells; 70% and 30%, respectively. The heterogeneous aberrations are listed in Additional data file 8 except those with a copy number of 2&3, since the lack of 3 DNA copies in this tumor prevented statistical analysis to identify 2&3 heterogeneity. (c) Schematic diagram of two possible evolutionary sequences for the aberrations, one parallel and one serial sequence, are shown. The blue and red circles represent the blue and red aberrations in (b). The percentages indicate the fractions of tumor cells with the listed aberrations, as calculated by GeneCount, showing that the aberrations in blue and red are present in 70% and 30% of the tumor cells, respectively.
Similar articles
- Combined array-comparative genomic hybridization and single-nucleotide polymorphism-loss of heterozygosity analysis reveals complex genetic alterations in cervical cancer.
Kloth JN, Oosting J, van Wezel T, Szuhai K, Knijnenburg J, Gorter A, Kenter GG, Fleuren GJ, Jordanova ES. Kloth JN, et al. BMC Genomics. 2007 Feb 20;8:53. doi: 10.1186/1471-2164-8-53. BMC Genomics. 2007. PMID: 17311676 Free PMC article. - DNA copy number abnormality of oral squamous cell carcinoma detected with cDNA array-based comparative genomic hybridization.
Zhou X, Jordan RC, Mok S, Birrer MJ, Wong DT. Zhou X, et al. Cancer Genet Cytogenet. 2004 May;151(1):90-2. doi: 10.1016/j.cancergencyto.2003.10.009. Cancer Genet Cytogenet. 2004. PMID: 15120918 No abstract available. - Challenges in array comparative genomic hybridization for the analysis of cancer samples.
Nowak NJ, Miecznikowski J, Moore SR, Gaile D, Bobadilla D, Smith DD, Kernstine K, Forman SJ, Mhawech-Fauceglia P, Reid M, Stoler D, Loree T, Rigual N, Sullivan M, Weiss LM, Hicks D, Slovak ML. Nowak NJ, et al. Genet Med. 2007 Sep;9(9):585-95. doi: 10.1097/gim.0b013e3181461c4a. Genet Med. 2007. PMID: 17873646 - Detection of DNA copy number alterations in cancer by array comparative genomic hybridization.
Michels E, De Preter K, Van Roy N, Speleman F. Michels E, et al. Genet Med. 2007 Sep;9(9):574-84. doi: 10.1097/gim.0b013e318145b25b. Genet Med. 2007. PMID: 17873645 Review. - Microarray-based comparative genomic hybridization and its applications in human genetics.
Oostlander AE, Meijer GA, Ylstra B. Oostlander AE, et al. Clin Genet. 2004 Dec;66(6):488-95. doi: 10.1111/j.1399-0004.2004.00322.x. Clin Genet. 2004. PMID: 15521975 Review.
Cited by
- Absolute quantification of somatic DNA alterations in human cancer.
Carter SL, Cibulskis K, Helman E, McKenna A, Shen H, Zack T, Laird PW, Onofrio RC, Winckler W, Weir BA, Beroukhim R, Pellman D, Levine DA, Lander ES, Meyerson M, Getz G. Carter SL, et al. Nat Biotechnol. 2012 May;30(5):413-21. doi: 10.1038/nbt.2203. Nat Biotechnol. 2012. PMID: 22544022 Free PMC article. - Allele-specific copy number analysis of tumors.
Van Loo P, Nordgard SH, Lingjærde OC, Russnes HG, Rye IH, Sun W, Weigman VJ, Marynen P, Zetterberg A, Naume B, Perou CM, Børresen-Dale AL, Kristensen VN. Van Loo P, et al. Proc Natl Acad Sci U S A. 2010 Sep 28;107(39):16910-5. doi: 10.1073/pnas.1009843107. Epub 2010 Sep 13. Proc Natl Acad Sci U S A. 2010. PMID: 20837533 Free PMC article. - High quality copy number and genotype data from FFPE samples using Molecular Inversion Probe (MIP) microarrays.
Wang Y, Carlton VE, Karlin-Neumann G, Sapolsky R, Zhang L, Moorhead M, Wang ZC, Richardson AL, Warren R, Walther A, Bondy M, Sahin A, Krahe R, Tuna M, Thompson PA, Spellman PT, Gray JW, Mills GB, Faham M. Wang Y, et al. BMC Med Genomics. 2009 Feb 19;2:8. doi: 10.1186/1755-8794-2-8. BMC Med Genomics. 2009. PMID: 19228381 Free PMC article. - Alterations in genes of the EGFR signaling pathway and their relationship to EGFR tyrosine kinase inhibitor sensitivity in lung cancer cell lines.
Gandhi J, Zhang J, Xie Y, Soh J, Shigematsu H, Zhang W, Yamamoto H, Peyton M, Girard L, Lockwood WW, Lam WL, Varella-Garcia M, Minna JD, Gazdar AF. Gandhi J, et al. PLoS One. 2009;4(2):e4576. doi: 10.1371/journal.pone.0004576. Epub 2009 Feb 24. PLoS One. 2009. PMID: 19238210 Free PMC article. - Interplay between promoter methylation and chromosomal loss in gene silencing at 3p11-p14 in cervical cancer.
Lando M, Fjeldbo CS, Wilting SM, C Snoek B, Aarnes EK, Forsberg MF, Kristensen GB, Steenbergen RD, Lyng H. Lando M, et al. Epigenetics. 2015;10(10):970-80. doi: 10.1080/15592294.2015.1085140. Epigenetics. 2015. PMID: 26291246 Free PMC article.
References
- Knuutila S, Aalto Y, Autio K, Bjorkqvist AM, El-Rifai W, Hemmer S, Huhta T, Kettunen E, Kiuru-Kuhlefelt S, Larramendy ML, Lushnikova T, Monni O, Pere H, Tapper J, Tarkkanen M, Varis A, Wasenius VM, Wolf M, Zhu Y. DNA copy number losses in human neoplasms. Am J Pathol. 1999;155:683–694. - PMC - PubMed
Publication types
MeSH terms
Substances
LinkOut - more resources
Full Text Sources
Other Literature Sources
Molecular Biology Databases
