Promoter elements associated with RNA Pol II stalling in the Drosophila embryo - PubMed (original) (raw)
Promoter elements associated with RNA Pol II stalling in the Drosophila embryo
David A Hendrix et al. Proc Natl Acad Sci U S A. 2008.
Abstract
RNA Polymerase II (Pol II) is bound to the promoter regions of many or most developmental control genes before their activation during Drosophila embryogenesis. It has been suggested that Pol II stalling is used to produce dynamic and rapid responses of developmental patterning genes to transient cues such as extracellular signaling molecules. Here, we present a combined computational and experimental analysis of stalled promoters to determine how they come to bind Pol II in the early Drosophila embryo. At least one-fourth of the stalled promoters contain a shared sequence motif, the "pause button" (PB): KCGRWCG. The PB motif is sometimes located in the position of the DPE, and over one-fifth of the stalled promoters contain the following arrangement of core elements: GAGA, Inr, PB, and/or DPE. This arrangement was used to identify additional stalled promoters in the Drosophila genome, and permanganate footprint assays were used to confirm that the segmentation gene engrailed contains paused Pol II as seen for heat-shock genes. We discuss different models for Pol II binding and gene activation in the early embryo.
Conflict of interest statement
The authors declare no conflict of interest.
Figures
Fig. 1.
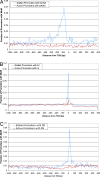
Motif positional distributions. These figures demonstrate the positional frequency of GAGA, Inr, and PB motifs. The curve shows the fraction of promoters from a given set (stalled or active) that have an instance of the motif in discrete and nonoverlapping 10-bp windows relative to the TSS, centered on multiples of 10.
Fig. 2.
PB vs. DPE. (A) LOGO for the “Pause Button” (PB) motif, computed from instances in stalled promoters. (B) LOGO for matches to the DPE consensus (RGWYV) in stalled promoters. (C) LOGO for matches to the DPE consensus in active promoters. Stalled promoters show a DPE base composition that more closely matches the PB LOGO. Positions on the x axis of LOGOs do not represent position relative to the TSS, but show a 20-bp window around the core of each motif, centered such that positions of similar base composition match for each motif.
Fig. 3.
Graphical representation of promoter sequences. All promoters sorted by stalling index in _Toll_10b mutants. This figure demonstrates that stalled genes have a higher concentration of GAGA (red), Inr (green), and PB (black) motifs. The main section of the figure shows a horizontal line for each promoter (one pixel thick), with a colored line representing an instance of a motif. The curve on the right shows the percentage of promoters with an occurrence of each motif in a 100-promoter window as a function of stalling index. The schematic representation of a promoter (top) shows a rectangle for each motif in its modal position.
Fig. 4.
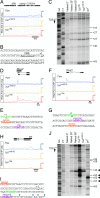
Predicting DV genes that have stalled Pol II. A genome browser (
http://flybuzz.berkeley.edu/cgi-bin/gbrowse/fly4\_3
) was constructed to integrate all of the results of RNA Pol II ChIP-chip analyses performed with three 2–4 h AED mutant embryos; _Toll_10b (red), _Toll_rm9/rm10 (yellow), and Pipe (blue). (A, B, and D–I) Results of RNA Pol II ChIP-chip analyses on the loci of usnp (A and B), Mes2 (D and E), Wnt2 (F and G), and en (H and I). Gene prediction models are displayed above each graphical presentation. Each 3′ end is labeled with open triangle. (B, E, G, and I) Promoter sequences around transcription start site (TSS). Each TSS (+1) is underlined. GAGA element, Initiator (Inr) and Pause Button (PB)/Downstream Promoter Element (DPE) are shown in red, green and purple, respectively. (C and J) Permanganate protection assays were done for usnp (C) and engrailed (en) (J) in 2–4 h _Toll_10b, _Toll_rm9/rm10, and gd7 mutants. Transcription start sites (TSSs) are marked on the left and the location of prominent bands relative to TSS (+1) are shown on the right of the autoradiograms. Genomic sequences of G+A and C+T are shown as size markers. As a control, purified genomic DNA from yw embryos was either not treated (Naked 0″) or treated (Naked 30″ and 60″) with 20 mM KMnO4 for 30 and 60 sec. Arrowheads indicate prominent pyrimidine residues (T or C) modified only in chromatin isolated from three mutant embryos by KMnO4 treatment, implying the existence of transcription bubbles in vivo. (B and I) RNA Pol II ChIP-chip results and promoter sequences around TSS of usnp (B) and en (I) are shown.
Similar articles
- NELF and GAGA factor are linked to promoter-proximal pausing at many genes in Drosophila.
Lee C, Li X, Hechmer A, Eisen M, Biggin MD, Venters BJ, Jiang C, Li J, Pugh BF, Gilmour DS. Lee C, et al. Mol Cell Biol. 2008 May;28(10):3290-300. doi: 10.1128/MCB.02224-07. Epub 2008 Mar 10. Mol Cell Biol. 2008. PMID: 18332113 Free PMC article. - Paused Pol II coordinates tissue morphogenesis in the Drosophila embryo.
Lagha M, Bothma JP, Esposito E, Ng S, Stefanik L, Tsui C, Johnston J, Chen K, Gilmour DS, Zeitlinger J, Levine MS. Lagha M, et al. Cell. 2013 May 23;153(5):976-87. doi: 10.1016/j.cell.2013.04.045. Cell. 2013. PMID: 23706736 Free PMC article. - Stalled Hox promoters as chromosomal boundaries.
Chopra VS, Cande J, Hong JW, Levine M. Chopra VS, et al. Genes Dev. 2009 Jul 1;23(13):1505-9. doi: 10.1101/gad.1807309. Epub 2009 Jun 10. Genes Dev. 2009. PMID: 19515973 Free PMC article. - Regulation of snRNA gene expression by the Drosophila melanogaster small nuclear RNA activating protein complex (DmSNAPc).
Hung KH, Stumph WE. Hung KH, et al. Crit Rev Biochem Mol Biol. 2011 Feb;46(1):11-26. doi: 10.3109/10409238.2010.518136. Epub 2010 Oct 6. Crit Rev Biochem Mol Biol. 2011. PMID: 20925482 Review. - The RNA Polymerase II Core Promoter in Drosophila.
Vo Ngoc L, Kassavetis GA, Kadonaga JT. Vo Ngoc L, et al. Genetics. 2019 May;212(1):13-24. doi: 10.1534/genetics.119.302021. Genetics. 2019. PMID: 31053615 Free PMC article. Review.
Cited by
- A Tremendous Reorganization Journey for the 3D Chromatin Structure from Gametes to Embryos.
Chen Z, Chen X. Chen Z, et al. Genes (Basel). 2022 Oct 15;13(10):1864. doi: 10.3390/genes13101864. Genes (Basel). 2022. PMID: 36292750 Free PMC article. Review. - Interpreting the regulatory genome: the genomics of transcription factor function in Drosophila melanogaster.
Slattery M, Nègre N, White KP. Slattery M, et al. Brief Funct Genomics. 2012 Sep;11(5):336-46. doi: 10.1093/bfgp/els034. Brief Funct Genomics. 2012. PMID: 23023663 Free PMC article. - Transcription initiation patterns indicate divergent strategies for gene regulation at the chromatin level.
Rach EA, Winter DR, Benjamin AM, Corcoran DL, Ni T, Zhu J, Ohler U. Rach EA, et al. PLoS Genet. 2011 Jan 13;7(1):e1001274. doi: 10.1371/journal.pgen.1001274. PLoS Genet. 2011. PMID: 21249180 Free PMC article. - Promoter proximal pausing on genes in metazoans.
Gilmour DS. Gilmour DS. Chromosoma. 2009 Feb;118(1):1-10. doi: 10.1007/s00412-008-0182-4. Epub 2008 Oct 2. Chromosoma. 2009. PMID: 18830703 Review. - Synchronous and stochastic patterns of gene activation in the Drosophila embryo.
Boettiger AN, Levine M. Boettiger AN, et al. Science. 2009 Jul 24;325(5939):471-3. doi: 10.1126/science.1173976. Science. 2009. PMID: 19628867 Free PMC article.
References
- Stathopoulos A, Levine M. Genomic regulatory networks and animal development. Dev Cell. 2005;9:449–462. - PubMed
- Rushlow CA, Han K, Manley JL, Levine M. The graded distribution of the dorsal morphogen is initiated by selective nuclear transport in Drosophila. Cell. 1989;59:1165–1177. - PubMed
- Roth S, Stein D, Nüsslein-Volhard C. A gradient of nuclear localization of the dorsal protein determines dorsoventral pattern in the Drosophila embryo. Cell. 1989;59:1189–1202. - PubMed
- Stathopoulos A, Van Drenth M, Erives A, Markstein M, Levine M. Whole-genome analysis of dorsal-ventral patterning in the Drosophila embryo. Cell. 2002;111:687–701. - PubMed
Publication types
MeSH terms
Substances
LinkOut - more resources
Full Text Sources
Other Literature Sources
Molecular Biology Databases


