Opposing patterns of signaling activation in dopamine D1 and D2 receptor-expressing striatal neurons in response to cocaine and haloperidol - PubMed (original) (raw)
Opposing patterns of signaling activation in dopamine D1 and D2 receptor-expressing striatal neurons in response to cocaine and haloperidol
Jesus Bertran-Gonzalez et al. J Neurosci. 2008.
Abstract
Psychostimulants and other drugs of abuse activate extracellular signal-regulated kinase (ERK) in the striatum, through combined stimulation of dopamine D(1) receptors (D1Rs) and glutamate NMDA receptors. Antipsychotic drugs activate similar signaling proteins in the striatum by blocking dopamine D(2) receptors (D2Rs). However, the neurons in which these pathways are activated by psychotropic drugs are not precisely identified. We used transgenic mice, in which enhanced green fluorescent protein (EGFP) expression was driven by D1R promoter (drd1a-EGFP) or D2R promoter (drd2-EGFP). We confirmed the expression of drd1a-EGFP in striatonigral and drd2-EGFP in striatopallidal neurons. Drd2-EGFP was also expressed in cholinergic interneurons, whereas no expression of either promoter was detected in GABAergic interneurons. Acute cocaine treatment increased phosphorylation of ERK and its direct or indirect nuclear targets, mitogen- and stress-activated kinase-1 (MSK1) and histone H3, exclusively in D1R-expressing output neurons in the dorsal striatum and nucleus accumbens. Cocaine-induced expression of c-Fos and Zif268 predominated in D1R-expressing neurons but was also observed in D2R-expressing neurons. One week after repeated cocaine administration, cocaine-induced signaling responses were decreased, with the exception of enhanced ERK phosphorylation in dorsal striatum. The responses remained confined to D1R neurons. In contrast, acute haloperidol injection activated phosphorylation of ERK, MSK1, and H3 only in D2R neurons and induced c-fos and zif268 predominantly in these neurons. Our results demonstrate that cocaine and haloperidol specifically activate signaling pathways in two completely segregated populations of striatal output neurons, providing direct evidence for the selective mechanisms by which these drugs exert their long-term effects.
Figures
Figure 1.
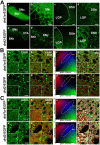
EGFP expression in BAC transgenic mice allows a clear distinction between D1R-striatonigral and D2R-striatopallidal neurons. A, Fluorescent axonal projections were found in the substantia nigra in _drd1a_-EGFP mice (a, b) and in the LGP in _drd2_-EGFP mice (c′, d′). Higher-magnification images are shown in b, b′, d, and d′. Neurons labeled in SNc and VTA of _drd2_-EGFP mice are likely to be DA neurons that contain D2 autoreceptors (a′, b′). Scale bars: a, c, a′, c′, 200 μm; b, d, b′, d′, 40 μm. B, C, Striatal sections from _drd1a_-EGFP and _drd2_-EGFP mice (Ba, Ba′, Ca, Ca′) are stained with antibodies for D1R (Bb, Bb′) and Gαolf (Cb, Cb′). A 2D cytofluorogram is plotted for each double-stained image (Bc, Bc′, Cc, Cc′), in which the region of interaction between the red channel (_y_-axis) and the green channel (_x_-axis) is displayed in blue (area of colocalization). The set of value pairs selected in the area of colocalization (ROI) are highlighted in white in the original image (Bd, Bd′, Cd, Cd′). Note the EGFP colocalization with D1R only in _drd1a_-EGFP mice (Bd, Bd′) and with Gαolf in both mouse strains (Cd, Cd′). Scale bars, 40 μm. Images are laser-scanning confocal microscope stacked sections (A) and single optical sections (B, C). DStr, Dorsal striatum; col, colocalization.
Figure 2.
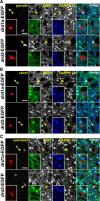
EGFP and DARPP-32 are not expressed in GABAergic interneurons in _drd1a_- and drd2-EGFP mice. Parvalbumin (parvalb; A), calretinin (calret; B), and somatostatin (somatost; C) immunoreactivity (red) was detected together with EGFP (green) and DARPP-32 (blue) immunoreactivity in the striatum of _drd1a_-EGFP (top) and _drd2_-EGFP (bottom) mice in a triple fluorescence analysis (insets, higher magnification). Arrowheads indicate the position of GABAergic interneurons. Merged images show that GABAergic interneurons do not express EGFP or DARPP-32. Single confocal sections are shown. Scale bars, 40 μm.
Figure 3.
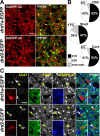
Expression of D1R and D2R in MSNs in various striatal regions. A, DARPP-32 immunofluorescence (red) identifies MSNs, and EGFP fluorescence labels cells that express D1R (top) and D2R (bottom). B, Estimation of the proportion of MSNs that express D1R, D2R, or both in the dorsal striatum (DStr; top), NAc shell (Shell; middle), and NAc core (Core; bottom), assuming that all MSNs express at least one of these receptors. Percentages were calculated by adding the percentage of DARPP-32-positive MSNs that were EGFP-positive neurons in _drd1a_-EGFP and _drd2_-EGFP mice. Numbers above 100% were taken as an indication of coexpression. Quantifications were obtained from several images (238 × 238 μm) per region of two to eight mice of each genotype. The percentage of EGFP-positive neurons were as follows: DStr, 58 ± 5% in D1R-expressing neurons (D1+) and 48 ± 3% in D2R-expressing neurons (D2+); Shell, 71.5 ± 4.5% in D1+ and 53.6 ± 2.8% in D2+; Core, 59.8 ± 1.2% in D1+ and 46.5 ± 2% in D2+. C, Identification of cholinergic interneurons. ChAT (red) and DARPP-32 (blue) immunoreactivity and EGFP fluorescence (green) in _drd1a_-EGFP (top) and _drd2_-EGFP (bottom) mice. Arrowheads indicate the position of cholinergic interneurons. Single confocal sections are shown. Scale bars, 40 μm.
Figure 4.
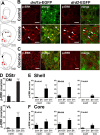
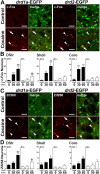
ERK activation occurs exclusively in D1R-expressing striatal neurons after acute administration of cocaine. A, The position of the striatal regions used for quantifcation is indicated by red circles on mouse brain coronal sections at various bregma (B) coordinates along the rostrocaudal axis (Paxinos and Franklin, 2001). S, NAc shell; C, NAc core; DM, dorsomedial part of the dorsal striatum; VL, ventrolateral part of the dorsal striatum. B, p-ERK immunoreactivity (red) and EGFP fluorescence (green) in the dorsal striatum of _drd1a_- and _drd2_-EGFP mice 15 min after cocaine (20 mg/kg) administration. Arrowheads show p-ERK immunoreactivity in D1R-positive neurons (left) and excluded from D2R-positive neurons (right). C, Higher magnification showing colocalization of p-ERK (red) and EGFP (green) in the neuropil of _drd1a_-EGFP mice (left) and its absence in _drd2_-EGFP mice (right). Single confocal sections are shown. D, Quantification of striatal p-ERK-immunoreactive neurons among EGFP-positive (D1+) or EGFP-negative (D1−) neurons in _drd1a_-EGFP mice, 15 min after cocaine injection, in the DM and VL parts of the DStr. E, F, Same quantifications at various rostrocaudal coordinates (indicated in A) of the shell (E) and the core (F) of the NAc. Data (means ± SEM; n = 3–8 mice per group) were analyzed using two-way ANOVA (values in supplemental Table 1, available at
as supplemental material). *p < 0.05; **p < 0.01; ***p < 0.001, control (cont) versus cocaine (coc) (Bonferroni test). Scale bars: B, 40 μm; C, 10 μm.
Figure 5.
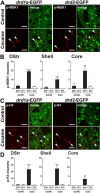
Acute cocaine induces MSK1 and histone H3 phosphorylation only in D1R-expressing striatal neurons. A, C, p-MSK1 (A, red) or p-H3 (C, red) immunofluorescence and EGFP fluorescence (green) in the dorsal striatum of _drd1a_- and _drd2_-EGFP mice, 15 min after cocaine treatment. Arrowheads show p-MSK1 (A) and p-H3 (C) immunoreactivity in D1R-positive neurons (left) and excluded from D2R-positive neurons (right). Single confocal sections are shown. Scale bars, 40 μm. B, D, Quantification of striatal p-MSK1-immunoreactive (B) and p-H3-immunoreactive (D) neurons among EGFP-positive (D1+) or EGFP-negative (D1−) neurons in _drd1a_-EGFP mice, 15 min after cocaine injection in various striatal regions (dorsal striatum, NAc). Data (means ± SEM; n = 4–8 mice per group) were analyzed using two-way ANOVA (values in supplemental Table 2, available at
as supplemental material). **p < 0.01; ***p < 0.001, control versus cocaine (Bonferroni test). DStr, Dorsal striatum; cont, control; coc, cocaine.
Figure 6.
Time course of ERK, MSK1, and histone H3 phosphorylation in D1R-striatonigral neurons after a single exposure to cocaine. A, B, EGFP fluorescence (green), p-ERK immunofluorescence (red), and p-MSK1 (blue, top) or p-H3 (blue, bottom) immunofluorescence in the dorsal striatum (DStr; A) and the NAc shell (B) of _drd1a_-EGFP mice. Arrowheads point to D1R-positive neurons that contain both p-ERK and p-MSK1 or p-H3. Photographs are single confocal sections. Scale bars, 40 μm. C–E, Percentage of EGFP-positive neurons immunoreactive for p-ERK (red, left y-axis), p-MSK1 (blue, right y-axis), and p-H3 (green, right y-axis) at various times after cocaine injection in drd1a-EGFP mice, in a different set of experiments from those in A and B: dorsal striatum (C), NAc shell (Shell; D), and NAc core (Core; E). Data (means ± SEM; n = 3–4 mice per group) were analyzed using one-way ANOVA (values in supplemental Table 3, available at www.jneurosci.org as supplemental material). Filled circles, p < 0.05, groups 2–60 min versus 0 min (Dunnett's multiple test); open circles, not significant.
Figure 7.
Acute cocaine exposure induces IEG expression in striatal D1R-expressing neurons and, to a lesser extent, in D2R-expressing neurons. A, C, Fluorescence of EGFP (green) and c-Fos (A) or Zif268 (C) immunoreactivity (red) in the dorsal striatum of drd1a- and drd2-EGFP mice 60 min after cocaine administration. Arrowheads indicate c-Fos (A) and Zif268 (C) expressed in D1R-expressing neurons in both strains of BAC transgenic mice. Arrows indicate c-Fos (A) and Zif268 (C) expressed in D2R-expressing neurons. Single confocal sections are shown. Scale bars, 40 μm. B, D, Quantification of c-Fos-immunoreactive (B) and Zif268-immunoreactive (D) neurons among EGFP-positive (D1+) and EGFP-negative (D1−) neurons in drd1a-EGFP mice 30 and 60 min after acute cocaine treatment in the dorsal striatum (DStr) and in the NAc shell and core. Data (means ± SEM; n = 4–8 mice per group) were analyzed using two-way ANOVA (values in supplemental Table 4, available at
as supplemental material). *p < 0.05, **p < 0.01, ***p < 0.001, group cont 0 versus groups coc 30 and coc 60 (D1+); ##p < 0.01, ###p < 0.001, group cont 0 versus groups coc 30 and coc 60 (D1−); ∘p < 0.05, ∘∘p < 0.01, ∘∘∘p < 0.001, group coc 30 versus coc 60 (Bonferroni test). cont 0, Control (0 min cocaine); coc 30, cocaine (30 min); coc 60, cocaine (60 min).
Figure 8.
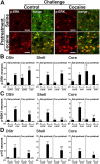
A cocaine challenge in mice previously exposed to this drug activates ERK, MSK1, and H3 phosphorylation exclusively in D1R-expressing neurons. Mice received a pretreatment with saline or cocaine and, after a 6 d withdrawal, a challenge injection of saline or cocaine (20 mg/kg). A, Fluorescence of p-ERK immunoreactivity (red) and EGFP (green) in the dorsal striatum, 15 min after a challenge injection of saline (control, left) or cocaine (right) in saline-pretreated (Sal-pretreat; top) or cocaine-pretreated (Coc-pretreat; bottom) drd1a-EGFP mice. Single confocal sections are shown. Scale bars, 40 μm. B–D, Quantification of p-ERK-immunoreactive (B), p-MSK1-immunoreactive (C), and p-H3-immunoreactive (D) neurons among EGFP-positive (D1+) or EGFP-negative (D1−) neurons in various striatal regions of drd1a-EGFP mice treated as in A. In the dorsal striatum (DStr) and NAc core of cocaine-pretreated mice, saline injection (cont) increased the number of p-ERK-positive neurons. In the dorsal striatum of cocaine-pretreated mice, cocaine injection (coc) induced more p-ERK-positive neurons than in saline-pretreated mice. Data (means ± SEM; n = 4–7 mice per group) were analyzed using three-way ANOVA (values in supplemental Table 5, available at
as supplemental material). ***p < 0.001, cont vs coc; ∘p < 0.05, ∘∘p < 0.01, ∘∘∘p < 0.001, saline-pretreated versus cocaine-pretreated (Bonferroni test). ∘∘∘p < 0.001, saline-pretreated versus cocaine-pretreated (Bonferroni test).
Figure 9.
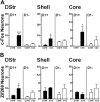
c-fos and zif268 induction by a cocaine challenge in mice previously exposed to this drug is decreased and restricted to D1R-expressing neurons. Mice received five daily cocaine injections and, after a 6 d withdrawal, a challenge injection of saline (cont) or cocaine (coc). Quantification of c-Fos-immunoreactive (A) and Zif268-immunoreactive (B) neurons among EGFP-positive (D1+) and EGFP-negative (D1−) neurons in drd1a-EGFP mice 60 min after a challenge injection of saline (cont) or cocaine (coc) in cocaine-pretreated drd1a-EGFP mice is shown. Data (means ± SEM; n = 3 mice per group) were analyzed using two-way ANOVA (values in supplemental Table 6, available at
as supplemental material). *p < 0.05, **p < 0.01, ***p < 0.001, group control versus cocaine (Bonferroni test).
Figure 10.
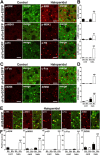
Haloperidol induces ERK, MSK1, and H3 phosphorylation, as well as c-Fos and Zif268 expression, in D2R-expressing striatal neurons. drd1a- and drd2-EGFP mice were injected [haloperidol (halo)] or not [control (cont)] with 0.5 mg/kg haloperidol and perfused after 15 min (A, B) or 60 min (C, D). A, C, Immunofluorescence (red) of p-ERK, p-MSK1, p-H3, c-Fos, and Zif268 alone or in combination with EGFP fluorescence (green, merge) in the dorsal striatum of drd1a-EGFP mice. B, D, The number of immunoreactive neurons was quantified for each marker among EGFP-positive (D1+) and EGFP-negative (D1−) neurons. E, F, Similar experiments were performed in drd2-EGFP mice, E, Immunofluorescence of p-ERK, p-MSK1, p-H3, c-Fos, and Zif268 (red) alone or in combination with EGFP fluorescence (green, merge) in the dorsal striatum of drd2-EGFP mice after haloperidol administration. F, The number of immunoreactive neurons for each marker in the absence (D2−) or presence (D2+) of EGFP fluorescence in the dorsal striatum of drd2-EGFP mice 15 min (p-ERK, p-MSK1, p-H3) and 60 min (c-Fos, Zif268) after haloperidol injection. Data (means ± SEM; n = 3–8 mice per group) were analyzed using two-way ANOVA (values in supplemental Table 7, available at www.jneurosci.org as supplemental material). *p < 0.05, ***p < 0.001 cont versus halo (D1+/D2−); ##p < 0.01, ###p < 0.001 cont versus halo (D1−/D2+) (Bonferroni test). Single confocal sections are shown. Scale bars, 40 μm.
_## References
1. 1. Alexander GE, DeLong MR, Strick PL. Parallel organization of functionally segregated circuits linking basal ganglia and cortex. Annu Rev Neurosci. 1986;9:357–381. - PubMed 2. 1. Badiani A, Oates MM, Day HE, Watson SJ, Akil H, Robinson TE. Environmental modulation of amphetamine-induced c-fos expression in D1 versus D2 striatal neurons. Behav Brain Res. 1999;103:203–209. - PubMed 3. 1. Berke JD, Hyman SE. Addiction, dopamine, and the molecular mechanisms of memory. Neuron. 2000;25:515–532. - PubMed 4. 1. Brami-Cherrier K, Valjent E, Hervé D, Darragh J, Corvol JC, Pages C, Arthur SJ, Girault JA, Caboche J. Parsing molecular and behavioral effects of cocaine in mitogen- and stress-activated protein kinase-1-deficient mice. J Neurosci. 2005;25:11444–11454. - PMC - PubMed 5. 1. Crombag HS, Jedynak JP, Redmond K, Robinson TE, Hope BT. Locomotor sensitization to cocaine is associated with increased Fos expression in the accumbens, but not in the caudate. Behav Brain Res. 2002;136:455–462. - PubMed
## Publication types
## MeSH terms
## Substances
## LinkOut - more resources
* ### Full Text Sources * Europe PubMed Central * HighWire * PubMed Central * ### Molecular Biology Databases * Mouse Genome Informatics (MGI) * ### Miscellaneous * NCI CPTAC Assay Portal
