Two functional subsets of FOXP3+ regulatory T cells in human thymus and periphery - PubMed (original) (raw)
Two functional subsets of FOXP3+ regulatory T cells in human thymus and periphery
Tomoki Ito et al. Immunity. 2008 Jun.
Abstract
Previous studies suggest that thymus produces a homogenous population of natural regulatory T (Treg) cells that express a transcriptional factor FOXP3 and control autoimmunity through a cell-contact-dependent mechanism. We found two subsets of FOXP3+ natural Treg cells defined by the expression of the costimulatory molecule ICOS in the human thymus and periphery. Whereas the ICOS+FOXP3+ Treg cells used interleukin-10 to suppress dendritic cell function and transforming growth factor (TGF)-beta to suppress T cell function, the ICOS-FOXP3+ Treg cells used TGF-beta only. The survival and proliferation of the two subsets of Treg cells were differentially regulated by signaling through ICOS or CD28, respectively. We suggest that the selection of natural Treg cells in thymus is coupled with Treg cell differentiation into two subsets imprinted with different cytokine expression potentials and use both cell-contact-dependent and independent mechanisms for immunosuppression in periphery.
Figures
Figure 1
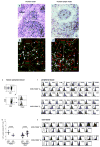
Two subsets of Foxp3+ TR defined by ICOS expression in thymus. a, Double staining of Foxp3 (red) and ICOS (blue) in the human thymus showing the Foxp3+ICOS+ and Foxp3+ICOS− two TR subsets located in the thymic medulla at a low magnification (100×). The scale bar, 50 μm. b, Double immunofluorescence staining of Foxp3 (red) and ICOS (green) performed on the same section of thymus further confirmed the two Foxp3+ T-cell populations: nuclear Foxp3+ cytoplasmic ICOS+ T cells and nuclear Foxp3+ cytoplasmic ICOS− T cells. c, Flow cytometric analysis of ICOS and CD25 expression on CD4+CD8− thymocytes and Foxp3 expression in sorted two TR subsets. d, Flow cytometric analysis of intracellular cytokines in each thymic TR subset after two rounds of culturing with anti-CD3 antibody in the presence of IL-2 and IL-7 on parental L cells or ICOSL-L cells for 5 days. e, Flow cytometric analysis of membrane TGF-β on each thymic TR subset after culturing with anti-CD3 antibody in the presence of IL-2 and IL-7 on parental L cells or ICOSL-L cells for 5 days. The numbers in the histograms indicate the mean fluorescence intensity, which is calculated by subtraction of mean fluorescence intensity with the isotype control from that with the anti-TGF-β antibody. f. Proliferative response of CD4+ CD25− T cells and thymic CD25high ICOS+ CD4+ TR or CD25high ICOS− CD4+ TR primed with anti-CD3 antibody in the presence of IL-2 and IL-7 on ICOSL-L cells for 5 days and their mixtures in response to T cell-depleted peripheral blood mononuclear cells was assessed by [3H]thymidine incorporation. Ratio of TR to CD4+ CD25− T cells is 1 to 2. Error bars represent the s.e.m. of triplicate wells. Similar results were observed in four (a, b) and three (c–f) experiments, and the results of a representative experiment are shown.
Figure 2
Two subsets of Foxp3+ TR defined by ICOS expression in periphery. a,c, Double staining of Foxp3 (red) and ICOS (blue) in the human tonsil (a) and lymph node (c) showing two Foxp3+ T cell populations: Foxp3+ICOS+ T cells and Foxp3+ICOS− T cells at a low magnification (100×). All scale bars, 50 μm. b,d, Immunofluorescence staining of Foxp3 (red) and ICOS (green) performed on the same section of tonsil (b) and lymph node (d) showing two Foxp3+ T-cell populations: nuclear Foxp3+ cytoplasmic ICOS+ TR and nuclear Foxp3+ cytoplasmic ICOS− TR. e, Human peripheral blood CD25high CD4+ TR were separated into ICOS+ and ICOS− subpopulations. Foxp3 expression in each subset was determined by flow cytometry. f, h, Phenotypical analysis of two subsets of TR in adult blood (f) and cord blood (h). Intranuclear Foxp3 and intracytoplasmic CTLA4 and the cell surface markers on sorted blood CD25high ICOS+ CD4+ TR and CD25high ICOS− CD4+ TR were determined by flow cytometry. g, Percentages of two subsets of TR in 6 thymus and 18 adult blood from healthy donors. Percentages of CD25high ICOS+ CD4+ TR and CD25high ICOS− CD4+ TR among CD4+ T cells were determined by flow cytometry. Bars represent the group means. Statistical significance was determined using paired Student’s _t_-test. Similar results were observed in three (a–d) and five (e) experiments, and at least three experiments for each marker (f, h), and the results of a representative experiment are shown.
Figure 3
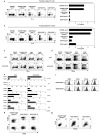
Different capacity of two TR subsets to produce cytokines. Blood CD25high ICOS+ TR, CD25high ICOS− TR, and whole CD25high CD4+ TR, as well as CD25−CD45RO− naïve and CD25−CD45RO+ memory T cells were isolated by same donor. a, b, Analysis of IL-10 and IL-2 production by freshly isolated T cell subsets (a) or T cells primed for 5 days with anti-CD3 antibody in the presence of IL-2 on parental L cells (b) by intracellular cytokine staining (left) and ELISA (right). ELISA data are means ± s.e.m. of four independent experiments. c–e, Blood TR and other T-cell subsets were cultured for 5 days with anti-CD3 antibody in the presence of IL-2 on parental L cells or ICOSL-L cells. Cytokine production of primed blood TR subsets were analyzed by flow cytometry (c, d) and ELISA (e). ELISA data are means ± s.e.m. of four independent experiments. Statistical significance was determined using paired Student’s _t_-test. *: p<0.05, **: p<0.01 (e). f, g, Flow cytometric analysis of CD25, ICOS, CTLA4, and Foxp3 expression with CFSE labeling by CD25−CD45RO+ memory T cells and TR subsets after culturing for 5 days with anti-CD3 antibody in the presence of IL-2. h, Flow cytometric analysis of IL-10 and Foxp3 expression in T-cell subsets after culturing for 5 days with anti-CD3 antibody in the presence of IL-2 on ICOSL-L cells. Similar flow cytometric results were observed in three experiments (a–d, f, g, h), and the results of a representative experiment are shown.
Figure 4
Foxp3+ICOS+CD25+ TR have the capacity to produce the highest levels of IL-10. a, Blood CD4+ T cells were separated into ICOS+CD45RO+ memory, ICOS−CD45RO+ memory, and ICOS−CD45RO− naive T cells based on the expression of ICOS and CD45RO. Flow cytometric analysis of intracellular cytokines in each T-cell subset after culturing with anti-CD3 antibody in the presence of IL-2 on parental L cells or ICOSL-L cells for 5 days. b, Flow cytometric analysis of Foxp3 expression by five subsets of CD4+CD45RO+ memory subpopulations: CD25−ICOS−CD45RO+ memory, CD25−ICOS+ follicular TH-like, CD25+ICOS+ TR, CD25+ICOS− TR, and CD25lowCD45RO+CRTH2+ TH2 memory T cells. c, d, Five blood CD4+ memory T-cell subpopulations were cultured with anti-CD3 antibody in the presence of IL-2 on parental L cells or ICOSL-L cells for 5 days. IL-10 production by T-cell subsets were analyzed by flow cytometry (c) and ELISA (d). ELISA data are means ± s.e.m. of four independent experiments. Similar flow cytometric results were observed in four experiments (a–c), and the results of a representative experiment are shown.
Figure 5
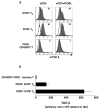
Different capacity of two subsets of TR to express TGF-β. a, Flow cytometric analysis of membrane TGF-β on the primed blood TR subsets after culturing with anti-CD3 antibody in the presence of IL-2 on parental L cells or ICOSL-L cells for 5 days. The numbers in the histograms indicate the mean fluorescence intensity, which is calculated by subtraction of mean fluorescence intensity with the isotype control from that with the anti-TGF-β antibody. Similar results were observed in three experiments, and the results of a representative experiment are shown. b, The real-time quantitative RT-PCR analysis for TGFB mRNA expression in blood CD25−CD45RO+CD4+ memory T cells, and two TR subsets after culturing with anti-CD3 antibody in the presence of IL-2 for 5 days. Data are means ± s.e.m. of three independent experiments.
Figure 6
Suppressive function of two subsets of TR. CD4+ naive T cells and autologous CD25high ICOS+ CD4+ TR or CD25high ICOS− CD4+ TR were sorted from human peripheral blood. CD4+ naive T cells were used as responder, and primed TR after culturing with anti-CD3 antibody in the presence of IL-2 on ICOSL-L cells for 5 days were used as suppressor. Mixtures of T-cell populations were cultured for 5 days with allogeneic monocyte-derived DCs as stimulator. The results using primed TR as suppressor were shown here, and that using freshly isolated TR were shown in Supplementary Figure 1. a, Ratios of TR to naive T cells are shown in the figure. Proliferation was assessed by [3H]thymidine incorporation and error bars represent the s.e.m. of triplicate wells. b, c, Ratio of TR to naive T cells is 1 to 2. Neutralizing anti-IL-10 plus IL-10 receptor antibodies and/or TGF-β receptor type I (TβRI) inhibitor were added into T-cell culture. Proliferation was assessed by [3H]thymidine incorporation and error bars represent the s.e.m. of triplicate wells. Statistical significance was determined using Student’s _t_-test. **: p<0.01 (b). CD4+ naive T cells were labeled with CFSE before culture, and cells after culturing were analyzed by flow cytometry, gated on CD4+CFSE+ cells (c). d, Indicated T-cell populations were cultured in Transwell at 1:2 ratio of TR to naive T cells with allogeneic monocyte-derived DCs. Proliferation was assessed by [3H]thymidine incorporation and error bars represent the s.e.m. of triplicate wells. e, Primed TR, naive T cells, and allogeneic monocyte-derived DCs were cultured at 1:1:1 ratio. After 4 days of culture, CD86 expression on DCs were analyzed by flow cytometry, gated on CD11c+ cells. Filled histogram indicates CD86 expression on DCs in coculture with naive T alone, and line histogram indicates CD86 expression on DCs in coculture with naive T and TR. Dot histogram indicates isotype control on DCs. Similar results were observed in three experiments (a–e), and the results of a representative experiment are shown.
Figure 7
Survival and expansion of two TR subsets were differentially regulated. a, b, Sorted blood CD25high ICOS+ CD4+ TR and CD25high ICOS− CD4+ TR were cultured in the absence of IL-2 on the idicated condtions for 5 days. Flow cytometric analysis of annexin V staining on each TR subset after culturing. The numbers in the histograms indicate the percentage of cells in the gate (a). The number of viable T cells counted by trypan-blue exclusion is shown in the bar graph (b). c, 5 × 10⁴ TR subsets and CD4+ naive T cells were cultured in the presence of IL-2 on the indicated conditions for 5 days. The viable cell number of each TR subset counted by trypan-blue exclusion is shown. Bars represent means of four experiments. d, 5 × 10⁴ TR subsets were cultured with blood pDCs or mDCs (DC/T cell ratio of 1:2) for 4 days in the presence of neutralizing anti-ICOSL mAb or neutralizing anti-CD80/CD86 mAbs. The viable cell number of each TR subset counted by trypan-blue exclusion is shown. Similar results were observed in three (a) and four (b, d) experiments, and the results of a representative experiment are shown.
Similar articles
- ICOS+ Foxp3+ TILs in gastric cancer are prognostic markers and effector regulatory T cells associated with Helicobacter pylori.
Nagase H, Takeoka T, Urakawa S, Morimoto-Okazawa A, Kawashima A, Iwahori K, Takiguchi S, Nishikawa H, Sato E, Sakaguchi S, Mori M, Doki Y, Wada H. Nagase H, et al. Int J Cancer. 2017 Feb 1;140(3):686-695. doi: 10.1002/ijc.30475. Epub 2016 Oct 27. Int J Cancer. 2017. PMID: 27756099 - Dendritic cells as controllers of antigen-specific Foxp3+ regulatory T cells.
Yamazaki S, Steinman RM. Yamazaki S, et al. J Dermatol Sci. 2009 May;54(2):69-75. doi: 10.1016/j.jdermsci.2009.02.001. Epub 2009 Mar 14. J Dermatol Sci. 2009. PMID: 19286352 Free PMC article. Review. - Glucocorticoid hormone differentially modulates the in vitro expansion and cytokine profile of thymic and splenic Treg cells.
Pap R, Ugor E, Litvai T, Prenek L, Najbauer J, Németh P, Berki T. Pap R, et al. Immunobiology. 2019 Mar;224(2):285-295. doi: 10.1016/j.imbio.2018.12.002. Epub 2018 Dec 27. Immunobiology. 2019. PMID: 30612787 - The fate of human Treg cells.
Battaglia M, Roncarolo MG. Battaglia M, et al. Immunity. 2009 Jun 19;30(6):763-5. doi: 10.1016/j.immuni.2009.06.006. Immunity. 2009. PMID: 19538927 - Natural and adaptive foxp3+ regulatory T cells: more of the same or a division of labor?
Curotto de Lafaille MA, Lafaille JJ. Curotto de Lafaille MA, et al. Immunity. 2009 May;30(5):626-35. doi: 10.1016/j.immuni.2009.05.002. Immunity. 2009. PMID: 19464985 Review.
Cited by
- Human regulatory T cells locally differentiate and are functionally heterogeneous within the inflamed arthritic joint.
Lutter L, van der Wal MM, Brand EC, Maschmeyer P, Vastert S, Mashreghi MF, van Loosdregt J, van Wijk F. Lutter L, et al. Clin Transl Immunology. 2022 Sep 30;11(10):e1420. doi: 10.1002/cti2.1420. eCollection 2022. Clin Transl Immunology. 2022. PMID: 36204213 Free PMC article. - The Roles of Immunoregulatory Networks in Severe Drug Hypersensitivity.
Hsu YO, Lu KL, Fu Y, Wang CW, Lu CW, Lin YF, Chang WC, Yeh KY, Hung SI, Chung WH, Chen CB. Hsu YO, et al. Front Immunol. 2021 Feb 26;12:597761. doi: 10.3389/fimmu.2021.597761. eCollection 2021. Front Immunol. 2021. PMID: 33717075 Free PMC article. Review. - Detailed bladder cancer immunoprofiling reveals new clues for immunotherapeutic strategies.
Viveiros N, Flores BC, Lobo J, Martins-Lima C, Cantante M, Lopes P, Deantonio C, Palu C, Sainson RC, Henrique R, Jerónimo C. Viveiros N, et al. Clin Transl Immunology. 2022 Sep 3;11(9):e1402. doi: 10.1002/cti2.1402. eCollection 2022. Clin Transl Immunology. 2022. PMID: 36092481 Free PMC article. - Role of the Gastric Microbiome in Gastric Cancer: From Carcinogenesis to Treatment.
Yang J, Zhou X, Liu X, Ling Z, Ji F. Yang J, et al. Front Microbiol. 2021 Mar 15;12:641322. doi: 10.3389/fmicb.2021.641322. eCollection 2021. Front Microbiol. 2021. PMID: 33790881 Free PMC article. Review. - IL-2 Expression in Activated Human Memory FOXP3(+) Cells Critically Depends on the Cellular Levels of FOXP3 as Well as of Four Transcription Factors of T Cell Activation.
Bendfeldt H, Benary M, Scheel T, Steinbrink K, Radbruch A, Herzel H, Baumgrass R. Bendfeldt H, et al. Front Immunol. 2012 Aug 27;3:264. doi: 10.3389/fimmu.2012.00264. eCollection 2012. Front Immunol. 2012. PMID: 22969764 Free PMC article.
References
- Akbari O, Freeman GJ, Meyer EH, Greenfield EA, Chang TT, Sharpe AH, Berry G, DeKruyff RH, Umetsu DT. Antigen-specific regulatory T cells develop via the ICOS-ICOS-ligand pathway and inhibit allergen-induced airway hyperreactivity. Nat Med. 2002;8:1024–1032. - PubMed
- Annunziato F, Romagnani P, Cosmi L, Beltrame C, Steiner BH, Lazzeri E, Raport CJ, Galli G, Manetti R, Mavilia C, et al. Macrophage-derived chemokine and EBI1-ligand chemokine attract human thymocytes in different stage of development and are produced by distinct subsets of medullary epithelial cells: possible implications for negative selection. J Immunol. 2000;165:238–246. - PubMed
- Aschenbrenner K, D’Cruz LM, Vollmann EH, Hinterberger M, Emmerich J, Swee LK, Rolink A, Klein L. Selection of Foxp3(+) regulatory T cells specific for self antigen expressed and presented by Aire(+) medullary thymic epithelial cells. Nat Immunol 2007 - PubMed
Publication types
MeSH terms
Substances
Grants and funding
- R01 AI062888/AI/NIAID NIH HHS/United States
- R01 AI062888-05/AI/NIAID NIH HHS/United States
- U19 AI071130/AI/NIAID NIH HHS/United States
- U19 AI071130-01/AI/NIAID NIH HHS/United States
LinkOut - more resources
Full Text Sources
Other Literature Sources
Research Materials


