Gating consequences of charge neutralization of arginine residues in the S4 segment of K(v)7.2, an epilepsy-linked K+ channel subunit - PubMed (original) (raw)
Gating consequences of charge neutralization of arginine residues in the S4 segment of K(v)7.2, an epilepsy-linked K+ channel subunit
Francesco Miceli et al. Biophys J. 2008 Sep.
Abstract
The K(v)7.2 subunits are the main molecular determinants of the M-current, a widespread K(+) current regulating neuronal excitability. Mutations in the K(v)7.2 gene cause benign familial neonatal seizures, an autosomally inherited human epilepsy. The benign familial neonatal seizure-causing mutations include those at arginine residues at positions 207 and 214 in the S(4) segment of K(v)7.2. In this study, each of the six S(4) arginines was individually replaced with neutral glutamines, and the functional properties of mutant channels were studied by whole-cell and single-channel voltage-clamp measurements. The results obtained suggest that each S(4) arginine residue plays a relevant role in the voltage-dependent gating of K(v)7.2 channels. In particular, a decreased positive charge at the N-terminal end of S(4) stabilized the activated state of the voltage-sensor, whereas positive-charge neutralization at the C-terminal end of S(4) favored the resting conformation. Strikingly, neutralization of a single arginine at position 201 was sufficient to cause a significant loss of voltage dependence in channel activation. Moreover, by comparing the functional properties of glutamine versus tryptophan substitution, we found steric bulk to play a relevant role at position 207, but not at position 214, in which the main functional effect of this disease-causing mutation seems to be a consequence of the loss of the positive charge.
Figures
FIGURE 1
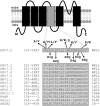
Schematic topology of a Kv7.2 subunit and sequence alignment of the S4 region among voltage-gated K+ channels. Shaded area corresponds to the S4 sequence. On top of the Kv7.2 sequence, amino-acid substitutions associated with BFNS are shown. Below the Kv7.2 sequence are the positions and nomenclatures of the mutations investigated.
FIGURE 2
Representative current traces of wt and R1Q, R3Q, R4Q, R5Q, and R6Q Kv7.2 mutants expressed in CHO cells. Each family of currents was recorded from a different cell held at −80 mV and then depolarized for 3 s from −120 to +20/+70 mV in 10-mV increments, followed by an isopotential pulse at 0 mV of 350-ms duration. For each set of recordings, arrows indicate current traces corresponding to the threshold potential and the 0-mV pulse. Current scale, 200 pA; timescale, 0.2 s.
FIGURE 3
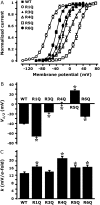
Analysis of gating properties of wt and R1Q, R3Q, R4Q, R5Q and R6Q Kv7.2 channels. (A) Steady-state activation curves, obtained by plotting normalized currents at the beginning of the 0-mV pulse as a function of the preceding conditioning potential. Continuous lines represent Boltzmann fits of the experimental data. _V_1/2 (expressed in mV, B) and k (expressed in mV/_e_-fold, C) values obtained for each indicated channel from the analysis of the data in A. *Values significantly different (p < 0.05) from the corresponding value of wtKv7.2 channels.
FIGURE 4
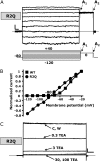
Biophysical and pharmacological properties of mutant R2Q Kv7.2 channels. (A) Representative current traces recorded using a voltage protocol in which the cell was held at −80 mV and then depolarized for 1.5 s from −120 to +40 mV in 20-mV increments, followed by an isopotential pulse at 0 mV of 350-ms duration. Below the traces is a schematic drawing of the voltage pulse protocol applied. A1 and A2 values refer to the beginning and end of 0-mV pulses, where current amplitudes were measured to calculate the time-dependent component (A2–A1/A2). (B) Plot of instantaneous currents normalized at the value obtained at −20 mV for both wt (squares, n = 20) and R2Q (circles, n = 10) Kv7.2 channels. (C) Currents from CHO cells expressing R2Q Kv7.2 channels were recorded using 2-s voltage steps to 0 mV, delivered at a frequency of 0.1 Hz from a holding voltage of −80mV. As indicated, the cell was sequentially exposed to control solution (C) and to 0.3, 3, 30, and 100 mM TEAe (each for ∼2 min), followed by washout (W). In both A and C, the current scale is 100 pA, and the timescale is 0.1 s.
FIGURE 5
Single-channel properties of wt and R2Q Kv7.2 channels. (A, top) Representative single-channel traces recorded using a ramp voltage protocol (from −100 mV to + 40 mV; 3-s duration). (Bottom) representative single-channel sweeps obtained using pulses to the indicated potentials (−80 mV and 0 mV). (B) Plot of open probability obtained at −80 mV and 0 mV, as indicated (n = 8–14 patches for each data set). (C) Plot of unitary current-voltage relationships of single wt and R2Q Kv7.2 channels. Straight lines represent linear fits of experimental data. Each data point derives from the analysis of 5–7 patches. Current scale, 0.5 pA; timescale, 0.5 s.
FIGURE 6
Comparison between gating properties of Kv7.2 channels carrying Q- or W-substituted R3 or R6 residues. (A) Representative current traces recorded using same voltage protocol described in Fig. 2. Insets, Comparisons of initial parts of normalized current traces at +20 mV for the indicated channels. (B) Steady-state activation curves, obtained by plotting normalized currents at the beginning of the 0-mV pulse as a function of the preceding conditioning potential. Continuous lines represent Boltzmann fits of the experimental data. _V_1/2 (expressed in mV, C) and k (expressed in mV/_e_-fold, D) values were obtained for each indicated channel. *Values significantly different (p < 0.05) from corresponding value for wtKv7.2 channels. Current scale, 200 pA; timescale, 0.2 s.
FIGURE 7
Three-dimensional homology model of Kv7.2 VSD. For clarity, only regions corresponding to the S2 and S4 segments are shown, as indicated. (A) wtKv7.2 subunit. (B) R3Q mutant Kv7.2 subunit. (C) R3W mutant Kv7.2 subunit. The peptide backbone is shown as gray ribbons. Residues at positions E130 (in S2) and R207 (in S4) are shown in green. Ionized hydrogen bonds are highlighted in yellow, and the highly conserved phenylalanine residue in S2 is shown in orange.
Similar articles
- Atypical gating of M-type potassium channels conferred by mutations in uncharged residues in the S4 region of KCNQ2 causing benign familial neonatal convulsions.
Soldovieri MV, Cilio MR, Miceli F, Bellini G, Miraglia del Giudice E, Castaldo P, Hernandez CC, Shapiro MS, Pascotto A, Annunziato L, Taglialatela M. Soldovieri MV, et al. J Neurosci. 2007 May 2;27(18):4919-28. doi: 10.1523/JNEUROSCI.0580-07.2007. J Neurosci. 2007. PMID: 17475800 Free PMC article. - Role of arginine residues on the S4 segment of the Bacillus halodurans Na+ channel in voltage-sensing.
Chahine M, Pilote S, Pouliot V, Takami H, Sato C. Chahine M, et al. J Membr Biol. 2004 Sep 1;201(1):9-24. doi: 10.1007/s00232-004-0701-z. J Membr Biol. 2004. PMID: 15635808 - Decreased subunit stability as a novel mechanism for potassium current impairment by a KCNQ2 C terminus mutation causing benign familial neonatal convulsions.
Soldovieri MV, Castaldo P, Iodice L, Miceli F, Barrese V, Bellini G, Miraglia del Giudice E, Pascotto A, Bonatti S, Annunziato L, Taglialatela M. Soldovieri MV, et al. J Biol Chem. 2006 Jan 6;281(1):418-28. doi: 10.1074/jbc.M510980200. Epub 2005 Oct 31. J Biol Chem. 2006. PMID: 16260777 - Neutralization of a unique, negatively-charged residue in the voltage sensor of K V 7.2 subunits in a sporadic case of benign familial neonatal seizures.
Miceli F, Soldovieri MV, Lugli L, Bellini G, Ambrosino P, Migliore M, del Giudice EM, Ferrari F, Pascotto A, Taglialatela M. Miceli F, et al. Neurobiol Dis. 2009 Jun;34(3):501-10. doi: 10.1016/j.nbd.2009.03.009. Epub 2009 Apr 1. Neurobiol Dis. 2009. PMID: 19344764 - Neonatal epilepsy syndromes and GEFS+: mechanistic considerations.
Burgess DL. Burgess DL. Epilepsia. 2005;46 Suppl 10:51-8. doi: 10.1111/j.1528-1167.2005.00359.x. Epilepsia. 2005. PMID: 16359473 Review.
Cited by
- Molecular dynamics simulations of voltage-gated cation channels: insights on voltage-sensor domain function and modulation.
Delemotte L, Klein ML, Tarek M. Delemotte L, et al. Front Pharmacol. 2012 May 25;3:97. doi: 10.3389/fphar.2012.00097. eCollection 2012. Front Pharmacol. 2012. PMID: 22654756 Free PMC article. - Distinctive mechanisms of epilepsy-causing mutants discovered by measuring S4 movement in KCNQ2 channels.
Edmond MA, Hinojo-Perez A, Wu X, Perez Rodriguez ME, Barro-Soria R. Edmond MA, et al. Elife. 2022 Jun 1;11:e77030. doi: 10.7554/eLife.77030. Elife. 2022. PMID: 35642783 Free PMC article. - Multistate structural modeling and voltage-clamp analysis of epilepsy/autism mutation Kv10.2-R327H demonstrate the role of this residue in stabilizing the channel closed state.
Yang Y, Vasylyev DV, Dib-Hajj F, Veeramah KR, Hammer MF, Dib-Hajj SD, Waxman SG. Yang Y, et al. J Neurosci. 2013 Oct 16;33(42):16586-93. doi: 10.1523/JNEUROSCI.2307-13.2013. J Neurosci. 2013. PMID: 24133262 Free PMC article. - Epileptic Encephalopathy In A Patient With A Novel Variant In The Kv7.2 S2 Transmembrane Segment: Clinical, Genetic, and Functional Features.
Soldovieri MV, Ambrosino P, Mosca I, Miceli F, Franco C, Canzoniero LMT, Kline-Fath B, Cooper EC, Venkatesan C, Taglialatela M. Soldovieri MV, et al. Int J Mol Sci. 2019 Jul 10;20(14):3382. doi: 10.3390/ijms20143382. Int J Mol Sci. 2019. PMID: 31295832 Free PMC article. - Structural Mechanism of ω-Currents in a Mutated Kv7.2 Voltage Sensor Domain from Molecular Dynamics Simulations.
Alberini G, Benfenati F, Maragliano L. Alberini G, et al. J Chem Inf Model. 2021 Mar 22;61(3):1354-1367. doi: 10.1021/acs.jcim.0c01407. Epub 2021 Feb 11. J Chem Inf Model. 2021. PMID: 33570938 Free PMC article.
References
- Hille, B. 2001. Ion Channels of Excitable Membranes. Sinauer Associates, Inc., Sunderland, MA.
- Doyle, D. A., J. Morais Cabral, R. A. Pfuetzner, A. Kuo, J. M. Gulbis, S. L. Cohen, B. T. Chait, and R. MacKinnon. 1998. The structure of the potassium channel: molecular basis of K+ conduction and selectivity. Science. 280:69–77. - PubMed
- Jiang, Y., A. Lee, J. Chen, M. Cadene, B. T. Chait, and R. MacKinnon. 2002. Crystal structure and mechanism of a calcium-gated potassium channel. Nature. 417:515–522. - PubMed
- Jiang, Y., A. Lee, J. Chen, M. Cadene, B. T. Chait, and R. MacKinnon. 2002. The open pore conformation of potassium channels. Nature. 417:523–526. - PubMed
- Kuo, A., J. M. Gulbis, J. F. Antcliff, T. Rahman, E. D. Lowe, J. Zimmer, J. Cuthbertson, F. M. Ashcroft, T. Ezaki, and D. A. Doyle. 2003. Crystal structure of the potassium channel KirBac1.1 in the closed state. Science. 300:1922–1926. - PubMed
Publication types
MeSH terms
Substances
LinkOut - more resources
Full Text Sources


