Blocking TGF-beta-Smad2/3 innate immune signaling mitigates Alzheimer-like pathology - PubMed (original) (raw)
Blocking TGF-beta-Smad2/3 innate immune signaling mitigates Alzheimer-like pathology
Terrence Town et al. Nat Med. 2008 Jun.
Abstract
Alzheimer's disease is the most common dementia and is pathologically characterized by deposition of amyloid-beta peptide (Abeta) into beta-amyloid plaques, neuronal injury and low-level, chronic activation of brain immunity. Transforming growth factor-betas (TGF-betas) are pleiotropic cytokines that have key roles in immune cell activation, inflammation and repair after injury. We genetically interrupted TGF-beta and downstream Smad2/3 signaling (TGF-beta-Smad2/3) in innate immune cells by inducing expression of CD11c promoter-driven dominant-negative TGF-beta receptor type II in C57BL/6 mice (CD11c-DNR), crossed these mice with mice overexpressing mutant human amyloid precursor protein, the Tg2576 Alzheimer's disease mouse model, and evaluated Alzheimer's disease-like pathology. Aged double-transgenic mice showed complete mitigation of Tg2576-associated hyperactivity and partial mitigation of defective spatial working memory. Brain parenchymal and cerebrovascular beta-amyloid deposits and Abeta abundance were markedly (up to 90%) attenuated in Tg2576-CD11c-DNR mice. This was associated with increased infiltration of Abeta-containing peripheral macrophages around cerebral vessels and beta-amyloid plaques. In vitro, cultures of peripheral macrophages, but not microglia, from CD11c-DNR mice showed blockade of classical TGF-beta-activated Smad2/3 but also showed hyperactivation of alternative bone morphogenic protein-activated Smad1/5/8 signaling and increased Abeta phagocytosis. Similar effects were noted after pharmacological inhibition of activin-like kinase-5, a type I TGF-beta receptor. Taken together, our results suggest that blockade of TGF-beta-Smad2/3 signaling in peripheral macrophages represents a new therapeutic target for Alzheimer's disease.
Figures
Figure 1
Reduced behavioral impairment in Tg2576–CD11c-DNR mice at 16–17 months of age. Four groups of littermate mice, including wild-type (WT, n = 13), CD11c-DNR (n = 6), Tg2576 (n = 11) and Tg2576–CD11c-DNR (n = 9) mice, were subjected to behavioral testing. (a) Mice were individually placed into a novel environment, and the distance traveled in cm (y axis) is represented over a 20-min time course in bins of 2.5 min each (x axis). (b) Mice were individually placed into a radially symmetric Y-maze and total number of arm entries (y axis) is shown for each genotype (x axis). (c) Number of mice (y axis) are shown grouped by bins of arm entries (10 entries per bin, x axis; Gaussian curves are shown for each mouse group) in the Y-maze. (d) Percentage alternation between Y-maze arms (y axis; chance level is shown with the dotted line) is represented for each genotype (x axis). Data are represented as group means ± s.e.m. For c, there is a rightward shift of the Tg2576 mouse group relative to WT and CD11c-DNR littermate controls (combined as they did not significantly differ) and to the Tg2576–CD11c-DNR mouse group. All post hoc statistical comparisons are versus Tg2576 mice, ***P < 0.001, **_P_ < 0.01, *_P_ < 0.05, †_P_ < 0.10. No significant difference was found between WT and CD11c-DNR mouse groups (_P_ > 0.05).
Figure 2
Reduced cerebral parenchymal and vascular β-amyloid deposits in Tg2576–CD11c-DNR mice at 17–18 months of age. (a) Photomicrographs from Tg2576 or Tg2576–CD11c-DNR mouse brain sections with median values by image analysis for human Aβ immunohistochemistry (antibody 4G8, bright-field photomicrographs, left) or histochemistry for thioflavin S (dark-field photomicrographs, right) are shown. CC, cingulate cortex; HC, hippocampus; EC, entorhinal cortex. (b) Photomicrographs were taken from cortical areas or hippocampus and quantitative image analysis for 4G8 (left) or thioflavin S burden (right) was conducted for Tg2576 (n = 12) and Tg2576–CD11c-DNR mice (n = 10). 4G8 or thioflavin S burden (% labeled area) is shown on the y axis, and brain region is represented on the x axis. Percentage reductions in Tg2576–CD11c-DNR versus littermate Tg2576 mice are indicated for each brain region. (c) Representative photomicrographs of thioflavin S histochemistry (inverted gray-scale, left) showing cerebral vascular β-amyloid deposits in Tg2576 or Tg2576–CD11c-DNR mice as indicated (arrows). Semiquantitative image analysis was performed (right), and severity of cerebral amyloid angiopathy (CAA score) is shown on the y axis with brain region indicated on the x axis. Scale bars in (a,c) denote 100 μm. Quantitative data are represented as group means (bars). All statistical comparisons are within brain region and between Tg2576 and Tg2576–CD11c-DNR mice, **P < 0.01 and ***P < 0.001.
Figure 3
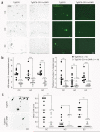
The CD11c-DNR transgene reduces astrocytosis but increases infiltrating macrophages in Alzheimer's disease mouse models. (a,b) Photomicrographs from Tg2576 (n = 12) and Tg2576–CD11c-DNR (n = 10) mouse brain sections (a), with median values by image analysis for GFAP immunohistochemistry (b); GFAP burden (% labeled area) is shown on the y axis and brain region is represented on the x axis. (c) Confocal micrographs of Tg2576 or Tg2576–CD11c-DNR brain sections (left, cerebrovessels; right, entorhinal cortex β-amyloid plaques) immunolabeled for human Aβ and mouse CD45 and counterstained with DAPI. Colocalization of Aβ with CD45+ cells in Tg2576–CD11c-DNR mice is denoted by arrows, and some of these cells contain Aβ deposits (high-magnification single optical section insets). (d) Quantitative image analysis for CD45 burden. All statistical comparisons are within brain region and between Tg2576 and Tg2576–CD11c-DNR mice, ***P < 0.001, *P < 0.05, †P < 0.10. (e) Double-transgenic Tg(APP,PSEN) mice were crossed with CD11c-DNR mice (designated Tg(APP,PSEN)–CD11c-DNR), and five mouse brains per group were pooled for FACS analysis with fluorescently tagged antibodies to CD45, CD11b and CD11c, as indicated. Log-fluorescence intensity for CD45 is indicated on the y axis, and forward scatter (FSC, a measure of cell size) is indicated on the x axis. Percentages of cells within each gate are indicated in top plots, and overlays of CD11b and CD11c are shown in bottom plots. Scale bars denote 100 μm (a) and 20 μm (c; 10 μm for insets).
Figure 4
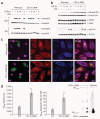
TGF-b1 shifts CD11c-DNR macrophages from canonical to alternate Smad signaling and increases Aβ phagocytosis in vitro. (a) Primary microglia (MG) or macrophages (MΦ) from wild-type or CD11c-DNR mice went untreated or were treated for 30 min with a dose range of recombinant TGF-β1 (1, 5 or 10 ng/ml as indicated) with or without 50 ng/ml of LPS. Cell lysates were western blotted for phosphorylated (p) and total Smad2/3 proteins as an indicator of canonical TGF-β-activated signaling. (b) Primary macrophages were treated as above and western blotted for phosphorylated and total Smad1/5/8 or p21-activated kinase 2 (Pak2; both activated in the alternate Smad signaling pathway), or extracellular signal-regulated kinase (Erk) 1/2. (c) Primary macrophages were pulsed for 4 h with 2 μg/ml of preaggregated Aβ488 and chased for 15 min before analysis by confocal microscopy with antibodies to CD11b or CD11c (merged images are shown on the right). (d) Quantification of confocal images (n = 3 randomly-selected fields per group) was performed, and Aβ488− labeled area is shown on the left. Numbers of Aβ488 phagocytic cells per field are shown in the middle graph. Data are represented as group means ± s.d. Cell lysates were prepared from macrophages treated in parallel with 2 μg/ml of unlabeled human synthetic Aβ1–42, and 2 ng of the peptide (cell-free) was western blotted side-by-side with antibody 6E10 (right). Data shown in (a–d) are representative of three to four independent experiments in which similar results were obtained.
Similar articles
- Selective deletion of apolipoprotein E in astrocytes ameliorates the spatial learning and memory deficits in Alzheimer's disease (APP/PS1) mice by inhibiting TGF-β/Smad2/STAT3 signaling.
Zheng JY, Sun J, Ji CM, Shen L, Chen ZJ, Xie P, Sun YZ, Yu RT. Zheng JY, et al. Neurobiol Aging. 2017 Jun;54:112-132. doi: 10.1016/j.neurobiolaging.2017.03.002. Epub 2017 Mar 11. Neurobiol Aging. 2017. PMID: 28366226 - Overexpression of human S100B exacerbates cerebral amyloidosis and gliosis in the Tg2576 mouse model of Alzheimer's disease.
Mori T, Koyama N, Arendash GW, Horikoshi-Sakuraba Y, Tan J, Town T. Mori T, et al. Glia. 2010 Feb;58(3):300-14. doi: 10.1002/glia.20924. Glia. 2010. PMID: 19705461 Free PMC article. - Partial inhibition of activin receptor-like kinase 4 alleviates bladder fibrosis caused by bladder outlet obstruction.
Wang N, Lu L, Cao QF, Qian S, Ding J, Wang C, Duan H, Shen H, Qi J. Wang N, et al. Exp Cell Res. 2021 Sep 1;406(1):112724. doi: 10.1016/j.yexcr.2021.112724. Epub 2021 Jul 6. Exp Cell Res. 2021. PMID: 34237300 - A tale of two proteins: differential roles and regulation of Smad2 and Smad3 in TGF-beta signaling.
Brown KA, Pietenpol JA, Moses HL. Brown KA, et al. J Cell Biochem. 2007 May 1;101(1):9-33. doi: 10.1002/jcb.21255. J Cell Biochem. 2007. PMID: 17340614 Review. - Immune Signaling in Neurodegeneration.
Hammond TR, Marsh SE, Stevens B. Hammond TR, et al. Immunity. 2019 Apr 16;50(4):955-974. doi: 10.1016/j.immuni.2019.03.016. Immunity. 2019. PMID: 30995509 Free PMC article. Review.
Cited by
- Intravenous infusion of monocytes isolated from 2-week-old mice enhances clearance of Beta-amyloid plaques in an Alzheimer mouse model.
Hohsfield LA, Humpel C. Hohsfield LA, et al. PLoS One. 2015 Apr 1;10(4):e0121930. doi: 10.1371/journal.pone.0121930. eCollection 2015. PLoS One. 2015. PMID: 25830951 Free PMC article. - TGF-β Signaling: A Therapeutic Target to Reinstate Regenerative Plasticity in Vascular Dementia?
Kandasamy M, Anusuyadevi M, Aigner KM, Unger MS, Kniewallner KM, de Sousa DMB, Altendorfer B, Mrowetz H, Bogdahn U, Aigner L. Kandasamy M, et al. Aging Dis. 2020 Jul 23;11(4):828-850. doi: 10.14336/AD.2020.0222. eCollection 2020 Jul. Aging Dis. 2020. PMID: 32765949 Free PMC article. Review. - Scara1 deficiency impairs clearance of soluble amyloid-β by mononuclear phagocytes and accelerates Alzheimer's-like disease progression.
Frenkel D, Wilkinson K, Zhao L, Hickman SE, Means TK, Puckett L, Farfara D, Kingery ND, Weiner HL, El Khoury J. Frenkel D, et al. Nat Commun. 2013;4:2030. doi: 10.1038/ncomms3030. Nat Commun. 2013. PMID: 23799536 Free PMC article. - Relationship Between Obesity, Alzheimer's Disease, and Parkinson's Disease: an Astrocentric View.
Martin-Jiménez CA, Gaitán-Vaca DM, Echeverria V, González J, Barreto GE. Martin-Jiménez CA, et al. Mol Neurobiol. 2017 Nov;54(9):7096-7115. doi: 10.1007/s12035-016-0193-8. Epub 2016 Oct 28. Mol Neurobiol. 2017. PMID: 27796748 Review. - Exercise suppresses neuroinflammation for alleviating Alzheimer's disease.
Wang M, Zhang H, Liang J, Huang J, Chen N. Wang M, et al. J Neuroinflammation. 2023 Mar 19;20(1):76. doi: 10.1186/s12974-023-02753-6. J Neuroinflammation. 2023. PMID: 36935511 Free PMC article. Review.
References
- Selkoe DJ. Alzheimer's disease: genes, proteins, and therapy. Physiol. Rev. 2001;81:741–766. - PubMed
- Li MO, Wan YY, Sanjabi S, Robertson AK, Flavell RA. Transforming growth factor-β regulation of immune responses. Annu. Rev. Immunol. 2006;24:99–146. - PubMed
- Laouar Y, Sutterwala FS, Gorelik L, Flavell RA. Transforming growth factor-β controls T helper type 1 cell development through regulation of natural killer cell interferon-gamma. Nat. Immunol. 2005;6:600–607. - PubMed
- Hsiao K, et al. Correlative memory deficits, Aβ elevation and amyloid plaques in transgenic mice. Science. 1996;274:99–102. - PubMed
Publication types
MeSH terms
Substances
Grants and funding
- 4R00AG029726/AG/NIA NIH HHS/United States
- HHMI/Howard Hughes Medical Institute/United States
- R00 AG029726/AG/NIA NIH HHS/United States
- R01 NS048335/NS/NINDS NIH HHS/United States
- K99 AG029726/AG/NIA NIH HHS/United States
- 1K99AG029726/AG/NIA NIH HHS/United States
LinkOut - more resources
Full Text Sources
Other Literature Sources
Medical
Molecular Biology Databases
Research Materials


