A crucial role for HVEM and BTLA in preventing intestinal inflammation - PubMed (original) (raw)
A crucial role for HVEM and BTLA in preventing intestinal inflammation
Marcos W Steinberg et al. J Exp Med. 2008.
Abstract
The interaction between the tumor necrosis factor (TNF) family member LIGHT and the TNF family receptor herpes virus entry mediator (HVEM) co-stimulates T cells and promotes inflammation. However, HVEM also triggers inhibitory signals by acting as a ligand that binds to B and T lymphocyte attenuator (BTLA), an immunoglobulin super family member. The contribution of HVEM interacting with these two binding partners in inflammatory processes remains unknown. In this study, we investigated the role of HVEM in the development of colitis induced by the transfer of CD4(+)CD45RB(high) T cells into recombination activating gene (Rag)(-/-) mice. Although the absence of HVEM on the donor T cells led to a slight decrease in pathogenesis, surprisingly, the absence of HVEM in the Rag(-/-) recipients led to the opposite effect, a dramatic acceleration of intestinal inflammation. Furthermore, the critical role of HVEM in preventing colitis acceleration mainly involved HVEM expression by radioresistant cells in the Rag(-/-) recipients interacting with BTLA. Our experiments emphasize the antiinflammatory role of HVEM and the importance of HVEM expression by innate immune cells in preventing runaway inflammation in the intestine.
Figures
Figure 1.
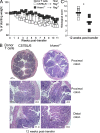
CD4+CD45RBhigh T cells do not require HVEM to induce colitis. (A) Weight loss curves of _Rag_−/− recipients transferred with 5 × 10⁵ CD4+CD45RBhigh T cells isolated from either WT C57BL/6 mice (open squares) or _Hvem_−/− mice (filled squares). The graph shows the average weight loss as a percentage of the initial weight of four mice in each group, and they are representative of four independent experiments. (B) H&E staining of proximal and distal colon of _Rag_−/− mice transferred with WT or _Hvem_−/− T cells. The histological scores of the representative sections shown are indicated (bottom right of each panel). GC, goblet cells. (C) Average scores of the proximal and distal colon sections were evaluated 12 wk after the transfer of T cells. Sections of the large intestine isolated from different recipients were microscopically analyzed as described in Materials and methods. Each square represents a single mouse (eight per group). *, P < 0.05.
Figure 2.
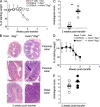
Colitis acceleration in _Hvem_−/−_Rag_−/− mice. Transfer of CD4+CD45RBhigh T cells into _Hvem_−/−_Rag_−/− mice dramatically accelerated colitis. (A) Weight loss curves of _Rag_−/− (squares) and _Hvem_−/−_Rag_−/− (circles) recipients of 5 × 10⁵ WT T cells showed an extremely rapid disease progression in _Hvem_−/−_Rag_−/− animals. Data correspond to the average of five mice per group and are representative of five independent experiments. (B) H&E staining of proximal and distal colon sections are shown. (C) Average scores of the proximal and distal colon sections from individual mice were evaluated 2 wk after the transfer of T cells. Each symbol represents an individual mouse (n = 5), and representative data from four experiments are shown. **, P < 0.005. (D) Weight loss comparison after transfer of WT (open circles) or _Hvem_−/− (filled circles) CD4+CD45RBhigh T cells into _Hvem_−/−_Rag_−/− recipients (n = 6–7). (E) Combined proximal and distal histological analysis of colon sections performed 2 wk after the transfers described in part D. Each symbol represents an individual mouse (n = 7).
Figure 3.
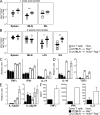
Increased T cells and cytokines in _Hvem_−/−_Rag_−/− recipients. The number of CD4+ TCR-β+ cells in the spleens, MLNs, and large intestines of recipient mice was assessed at the indicated times. (A) 1 wk after transfer, _Rag_−/− (squares) and _Hvem_−/−_Rag_−/− (circles) mice, four in each group, were analyzed by flow cytometry for T cells in the spleens, large IELs, and MLNs. (B) Shows same as in A, but including LPLs and analyzed 2 wk after transfer. Each symbol represents an individual mouse with a total of 7–10 mice per group. *, P < 0.05; **, P < 0.005. (C–E) Real-time PCR performed on tissue samples isolated from the large intestines of individual _Rag_−/− (filled bars) or _Hvem_−/−_Rag_−/− (open bars) recipients 2 wk after transfer. Error bars represent SD of triplicate measurements. (F) LPLs isolated from transferred _Hvem_−/−_Rag_−/− (open bars) and _Rag_−/− (filled bars) recipients at 2 wk were stimulated ex vivo with PMA and ionomycin. After 48 h, cytokines in the supernatant were measured by ELISA.
Figure 4.
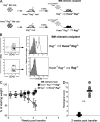
HVEM expression by radioresistant _Rag_−/− cells prevents colitis acceleration. (A) Experimental design. Lethally irradiated _Hvem_−/−_Rag_−/− mice were transplanted with _Rag_−/− BM cells to generate _Rag_−/−→_Hvem_−/−_Rag_−/− chimeric mice. Reciprocal _Hvem_−/−_Rag_−/−→_Rag_−/− chimeras also were generated. 10 wk after transplant, chimeric mice were used as recipients of CD4+CD45RBhigh T cells. (B) Analysis of reconstitution. HVEM expression in peripheral blood cells of the chimeric animals was assessed 8 wk after BM cell transplant by flow cytometry analysis for HVEM expression by CD45+ cells. Open histograms represent HVEM staining, and filled histograms represent the isotype control. Representative data are shown from one of many similar analyses of blood cells and cells from immune organs. (C) Transfer of 5 × 10⁵ CD4+CD45RBhigh T cells into _Hvem_−/−_Rag_−/−→_Rag_−/− (squares) and _Rag_−/−→_Hvem_−/−_Rag_−/− (gray circles) chimeric recipients. Weight loss curves correspond to the average of six to eight chimeric mice per group. (D) Histological scores were determined 2 wk after transfer. Each symbol represents a single mouse of a total of seven _Hvem_−/−_Rag_−/−→_Rag_−/− (squares) and eight _Rag_−/−→_Hvem_−/−_Rag_−/− (circles) chimeric mice. **, P < 0.005. Data shown are representative from one of two independent experiments.
Figure 5.
_Light_−/− T cells do not cause accelerated colitis. (A) Weight loss curves of _Rag_−/− recipients transferred with either WT (open squares) or _Light_−/− CD4+CD45RBhigh T cells (open diamonds). The graph shows the average of four mice per group and is representative of one of three independent experiments. (B) Average histological scores were evaluated 12 wk after T cell transfer. Each square represents a single mouse of a total of six to seven mice in each group. *, P < 0.05. (C) Results from the transfer of either WT (open circles) or _Light_−/− (filled circles) T cells into _Hvem_−/−_Rag_−/− mice. Data shown correspond to the average weight loss of six mice per group. (D) Average histological scores analyzed 2 wk after WT or _Light_−/− CD4+CD45RBhigh T cell transfer to _Hvem_−/−_Rag_−/− animals. Each circle represents a single mouse in a total of six mice per group.
Figure 6.
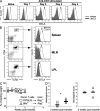
Minimal effect of T cell BTLA deficiency on colitis pathogenesis. (A) BTLA expression on freshly isolated naive CD4+ T cells and by CD4+ T cells stimulated in vitro with an anti-CD3_ε_ mAb in the presence of irradiated T cell–depleted splenocytes. (B) BTLA expression on transferred CD4+ T cells isolated from _Hvem_−/−_Rag_−/− recipients 2 wk after transfer. Histograms represent BTLA expression by gated CD4+ TCR-β+ cells from the indicated sites. (C) Transfer of _Btla_−/− CD4+CD45RBhigh T cells into _Rag_−/− recipients. Weight loss curves of _Rag_−/− recipients transferred with either WT T cells (squares) or _Btla_−/− T cells (triangles). Data shown represent the average of six to eight mice in each group. (D) Histological scores were evaluated 2 (left) or 5 wk (right) after the transfer of T cells. Each symbol represents an individual mouse (n = 5–8). Data are representative of four independent experiments. *, P < 0.05.
Figure 7.
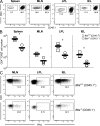
Reduced accumulation of _Btla_−/− T cells in _Rag_−/− recipients. Co-transfer of congenic CD45.1+ and CD45.2+_Btla_−/− CD4+CD45RBhigh T cells into _Rag_−/− recipients. (A) Representative percentages of CD45.1+ (Btla+/+) and CD45.1− (_Btla_−/−) CD4+ TCR-β+ cells in the spleens, MLNs, LPLs, and IELs of _Rag_−/− mice analyzed 2 wk after T cell transfer. (B) Same as A, but showing absolute numbers of CD45.1+ (squares) and CD45.1− (circles) CD4+TCR-β+ T cells. Each symbol represents an individual mouse (n = 4). *, P < 0.05. (C) Intracellular IFN-γ staining of CD4+TCR-β+ CD45.1+ (top dot plots) and CD45.1− (bottom dot plots) T cells isolated from _Rag_−/− mice and restimulated ex vivo with PMA and ionomycin. Data shown correspond to a single mouse in a total of four mice per group and are representative of two independent experiments.
Figure 8.
Signaling through BTLA prevents colitis acceleration in _Hvem_−/−_Rag_−/− recipients. (A) Weight loss curves of _Hvem_−/−_Rag_−/− mouse recipients of WT T cells treated with either 100 μg anti-BTLA mAb (clone 6F7) or IgG1 isotype control twice a week beginning at the time of T cell transfer. Data shown represent the average of four mice in each group and are representative of two independent experiments. (B) Histological scoring performed 3 wk after T cell transfer revealed milder intestinal inflammation in samples obtained from _Hvem_−/−_Rag_−/− animals treated with the anti-BTLA mAb. Each circle represents a single mouse in a total of eight mice per group. *, P < 0.05. (C) Same as A, except that _Hvem_−/−_Rag_−/− animals were transferred with _Btla_−/− CD4+CD45RBhigh T cells. (D) Histological analysis 3 wk after transfer revealed equivalent intestinal inflammation in all transferred _Hvem_−/−_Rag_−/− animals regardless of the treatment with the anti-BTLA mAb. Each circle represents a single mouse in a total of five mice per group.
Figure 9.
Accelerated colitis in _Btla_−/−_Rag_−/− recipients. (A) Weight loss curves of _Rag_−/− (squares) and _Btla_−/−_Rag_−/− (triangles) recipients transferred with 5 × 10⁵ WT T cells. Data correspond to the average of four to six mice per group. (B) Combined proximal and distal colon histological scores were evaluated 2 wk after T cell transfer. Each symbol represents an individual mouse from a total of six to seven animals per group. (C) Weight loss curves of _Hvem_−/−_Rag_−/− (circles) and _Btla_−/−_Rag_−/− (open triangles) recipients transferred with 5 × 10⁵ WT T cells, and _Btla_−/−_Rag_−/− mice transferred with 5 × 10⁵ _Btla_−/− T cells (filled triangles). Data correspond to the average of four to six mice per group and are representative of two independent experiments. (D) Histological scores performed on samples obtained from two independent experiments 2 wk after T cell transfer. Each symbol represents an individual mouse from a total of 5–11 animals per group. *, P < 0.05.
Similar articles
- Herpesvirus Entry Mediator Binding Partners Mediate Immunopathogenesis of Ocular Herpes Simplex Virus 1 Infection.
Park SJ, Riccio RE, Kopp SJ, Ifergan I, Miller SD, Longnecker R. Park SJ, et al. mBio. 2020 May 12;11(3):e00790-20. doi: 10.1128/mBio.00790-20. mBio. 2020. PMID: 32398314 Free PMC article. - A herpesvirus entry mediator mutein with selective agonist action for the inhibitory receptor B and T lymphocyte attenuator.
Šedý JR, Balmert MO, Ware BC, Smith W, Nemčovičova I, Norris PS, Miller BR, Aivazian D, Ware CF. Šedý JR, et al. J Biol Chem. 2017 Dec 22;292(51):21060-21070. doi: 10.1074/jbc.M117.813295. Epub 2017 Oct 23. J Biol Chem. 2017. PMID: 29061848 Free PMC article. - Role of B and T Lymphocyte Attenuator in Renal Transplant Recipients with Biopsy-Proven Acute Rejection.
Wang Z, Yang H, Liu X, Zhang J, Han Z, Tao J, Zhao C, Ju X, Tan R, Gu M. Wang Z, et al. Med Sci Monit. 2018 Jan 20;24:387-396. doi: 10.12659/msm.905752. Med Sci Monit. 2018. PMID: 29352109 Free PMC article. - BTLA and HVEM cross talk regulates inhibition and costimulation.
Gavrieli M, Sedy J, Nelson CA, Murphy KM. Gavrieli M, et al. Adv Immunol. 2006;92:157-85. doi: 10.1016/S0065-2776(06)92004-5. Adv Immunol. 2006. PMID: 17145304 Review. - Modulation of T cell proliferation through the LIGHT-HVEM-BTLA cosignaling pathway.
Cheung TC. Cheung TC. Recent Pat DNA Gene Seq. 2009;3(3):177-82. doi: 10.2174/187221509789318342. Recent Pat DNA Gene Seq. 2009. PMID: 19702559 Review.
Cited by
- BTLA expression declines on B cells of the aged and is associated with low responsiveness to the trivalent influenza vaccine.
Kannan S, Kurupati RK, Doyle SA, Freeman GJ, Schmader KE, Ertl HC. Kannan S, et al. Oncotarget. 2015 Aug 14;6(23):19445-55. doi: 10.18632/oncotarget.4597. Oncotarget. 2015. PMID: 26277622 Free PMC article. - Herpes Simplex Virus 1 Latency and the Kinetics of Reactivation Are Regulated by a Complex Network of Interactions between the Herpesvirus Entry Mediator, Its Ligands (gD, BTLA, LIGHT, and CD160), and the Latency-Associated Transcript.
Wang S, Ljubimov AV, Jin L, Pfeffer K, Kronenberg M, Ghiasi H. Wang S, et al. J Virol. 2018 Nov 27;92(24):e01451-18. doi: 10.1128/JVI.01451-18. Print 2018 Dec 15. J Virol. 2018. PMID: 30282707 Free PMC article. - Realigning the LIGHT signaling network to control dysregulated inflammation.
Ware CF, Croft M, Neil GA. Ware CF, et al. J Exp Med. 2022 Jul 4;219(7):e20220236. doi: 10.1084/jem.20220236. Epub 2022 May 23. J Exp Med. 2022. PMID: 35604387 Free PMC article. - Harringtonine Inhibits Herpes Simplex Virus Type 1 Infection by Reducing Herpes Virus Entry Mediator Expression.
Liu Y, You Q, Zhang F, Chen D, Huang Z, Wu Z. Liu Y, et al. Front Microbiol. 2021 Aug 31;12:722748. doi: 10.3389/fmicb.2021.722748. eCollection 2021. Front Microbiol. 2021. PMID: 34531841 Free PMC article. - Lymphocyte HVEM/BTLA co-expression after critical illness demonstrates severity indiscriminate upregulation, impacting critical illness-induced immunosuppression.
Wakeley ME, Armstead BE, Gray CC, Tindal EW, Heffernan DS, Chung CS, Ayala A. Wakeley ME, et al. Front Med (Lausanne). 2023 May 25;10:1176602. doi: 10.3389/fmed.2023.1176602. eCollection 2023. Front Med (Lausanne). 2023. PMID: 37305124 Free PMC article.
References
- Bouma, G., and W. Strober. 2003. The immunological and genetic basis of inflammatory bowel disease. Nat. Rev. Immunol. 3:521–533. - PubMed
- Sartor, R.B. 2003. Innate immunity in the pathogenesis and therapy of IBD. J. Gastroenterol. 38:43–47. - PubMed
- Targan, S.R. 2000. Biology of inflammation in Crohn's disease: mechanisms of action of anti-TNF-a therapy. Can. J. Gastroenterol. 14:13C–16C. - PubMed
- Cohavy, O., J. Zhou, S.W. Granger, C.F. Ware, and S.R. Targan. 2004. LIGHT expression by mucosal T cells may regulate IFN-gamma expression in the intestine. J. Immunol. 173:251–258. - PubMed
- Cohavy, O., J. Zhou, C.F. Ware, and S.R. Targan. 2005. LIGHT is constitutively expressed on T and NK cells in the human gut and can be induced by CD2-mediated signaling. J. Immunol. 174:646–653. - PubMed
Publication types
MeSH terms
Substances
Grants and funding
- R24 DK080506/DK/NIDDK NIH HHS/United States
- DK 080506/DK/NIDDK NIH HHS/United States
- AI61516/AI/NIAID NIH HHS/United States
- R01 AI061516/AI/NIAID NIH HHS/United States
- AI33068/AI/NIAID NIH HHS/United States
- R37 AI033068/AI/NIAID NIH HHS/United States
- R01 AI033068/AI/NIAID NIH HHS/United States
LinkOut - more resources
Full Text Sources
Other Literature Sources
Molecular Biology Databases
Research Materials
