Association of urinary phthalate metabolite concentrations with body mass index and waist circumference: a cross-sectional study of NHANES data, 1999-2002 - PubMed (original) (raw)
Association of urinary phthalate metabolite concentrations with body mass index and waist circumference: a cross-sectional study of NHANES data, 1999-2002
Elizabeth E Hatch et al. Environ Health. 2008.
Abstract
Background: Although diet and activity are key factors in the obesity epidemic, laboratory studies suggest that endocrine disrupting chemicals may also affect obesity.
Methods: We analyzed associations between six phthalate metabolites measured in urine and body mass index (BMI) and waist circumference (WC) in National Health and Nutrition Examination Survey (NHANES) participants aged 6-80. We included 4369 participants from NHANES 1999-2002, with data on mono-ethyl (MEP), mono-2-ethylhexyl (MEHP), mono-n-butyl (MBP), and mono-benzyl (MBzP) phthalate; 2286 also had data on mono-2-ethyl-5-hydroxyhexyl (MEHHP) and mono-2-ethyl-5-oxohexyl (MEOHP) phthalate (2001-2002). Using multiple regression, we computed mean BMI and WC within phthalate quartiles in eight age/gender specific models.
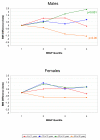
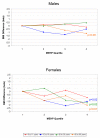
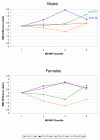
Results: The most consistent associations were in males aged 20-59; BMI and WC increased across quartiles of MBzP (adjusted mean BMI = 26.7, 27.2, 28.4, 29.0, p-trend = 0.0002), and positive associations were also found for MEOHP, MEHHP, MEP, and MBP. In females, BMI and WC increased with MEP quartile in adolescent girls (adjusted mean BMI = 22.9, 23.8, 24.1, 24.7, p-trend = 0.03), and a similar but less strong pattern was seen in 20-59 year olds. In contrast, MEHP was inversely related to BMI in adolescent girls (adjusted mean BMI = 25.4, 23.8, 23.4, 22.9, p-trend = 0.02) and females aged 20-59 (adjusted mean BMI = 29.9, 29.9, 27.9, 27.6, p-trend = 0.02). There were no important associations among children, but several inverse associations among 60-80 year olds.
Conclusion: This exploratory, cross-sectional analysis revealed a number of interesting associations with different phthalate metabolites and obesity outcomes, including notable differences by gender and age subgroups. Effects of endocrine disruptors, such as phthalates, may depend upon endogenous hormone levels, which vary dramatically by age and gender. Individual phthalates also have different biologic and hormonal effects. Although our study has limitations, both of these factors could explain some of the variation in the observed associations. These preliminary data support the need for prospective studies in populations at risk for obesity.
Figures
Figure 1
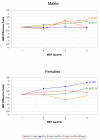
Difference in Body Mass Index, by Increasing MEP Quartile and Age Group. Top graph displays results for males, bottom graph for females. All estimates are adjusted for age, race/ethnicity, creatinine, height, SES, dietary factors, TV, Mets/month (age 12+), smoking (age 20+), and reproductive factors (age 20+ females). Results of trend tests are included for those with p-values<0.15.
Figure 2
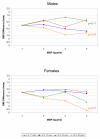
Difference in Body Mass Index, by Increasing MBP Quartile and Age Group. Top graph displays results for males, bottom graph for females. All estimates are adjusted for age, race/ethnicity, creatinine, height, SES, dietary factors, TV, Mets/month (age 12+), smoking (age 20+), and reproductive factors (age 20+ females). Results of trend tests are included for those with p-values<0.15.
Figure 3
Difference in Body Mass Index, by Increasing MBzP Quartile and Age Group. Top graph displays results for males, bottom graph for females. All estimates are adjusted for age, race/ethnicity, creatinine, height, SES, dietary factors, TV, Mets/month (age 12+), smoking (age 20+), and reproductive factors (age 20+ females). Results of trend tests are included for those with p-values<0.15.
Figure 4
Difference in Body Mass Index, by Increasing MEHP Quartile and Age Group. Top graph displays results for males, bottom graph for females. All estimates are adjusted for age, race/ethnicity, creatinine, height, SES, dietary factors, TV, Mets/month (age 12+), smoking (age 20+), and reproductive factors (age 20+ females). Results of trend tests are included for those with p-values<0.15.
Figure 5
Difference in Body Mass Index, by Increasing MEHHP Quartile and Age Group. Top graph displays results for males, bottom graph for females. All estimates are adjusted for age, race/ethnicity, creatinine, height, SES, dietary factors, TV, Mets/month (age 12+), smoking (age 20+), and reproductive factors (age 20+ females). Results of trend tests are included for those with p-values<0.15.
Similar articles
- Association of endocrine disruptors and obesity: perspectives from epidemiological studies.
Hatch EE, Nelson JW, Stahlhut RW, Webster TF. Hatch EE, et al. Int J Androl. 2010 Apr;33(2):324-32. doi: 10.1111/j.1365-2605.2009.01035.x. Epub 2010 Jan 22. Int J Androl. 2010. PMID: 20113374 Free PMC article. Review. - Age and sex differences in childhood and adulthood obesity association with phthalates: analyses of NHANES 2007-2010.
Buser MC, Murray HE, Scinicariello F. Buser MC, et al. Int J Hyg Environ Health. 2014 Jul;217(6):687-94. doi: 10.1016/j.ijheh.2014.02.005. Epub 2014 Mar 5. Int J Hyg Environ Health. 2014. PMID: 24657244 Free PMC article. - Predictors of urinary bisphenol A and phthalate metabolite concentrations in Mexican children.
Lewis RC, Meeker JD, Peterson KE, Lee JM, Pace GG, Cantoral A, Téllez-Rojo MM. Lewis RC, et al. Chemosphere. 2013 Nov;93(10):2390-8. doi: 10.1016/j.chemosphere.2013.08.038. Epub 2013 Sep 14. Chemosphere. 2013. PMID: 24041567 Free PMC article. - Association of urinary phthalate metabolites concentrations with body mass index and waist circumference.
Amin MM, Parastar S, Ebrahimpour K, Shoshtari-Yeganeh B, Hashemi M, Mansourian M, Kelishadi R. Amin MM, et al. Environ Sci Pollut Res Int. 2018 Apr;25(11):11143-11151. doi: 10.1007/s11356-018-1413-8. Epub 2018 Feb 7. Environ Sci Pollut Res Int. 2018. PMID: 29417479 - The Association of Bisphenol A and Phthalates with Risk of Breast Cancer: A Meta-Analysis.
Liu G, Cai W, Liu H, Jiang H, Bi Y, Wang H. Liu G, et al. Int J Environ Res Public Health. 2021 Mar 1;18(5):2375. doi: 10.3390/ijerph18052375. Int J Environ Res Public Health. 2021. PMID: 33804363 Free PMC article. Review.
Cited by
- Early-life exposure to endocrine disrupting chemicals associates with childhood obesity.
Yang C, Lee HK, Kong APS, Lim LL, Cai Z, Chung ACK. Yang C, et al. Ann Pediatr Endocrinol Metab. 2018 Dec;23(4):182-195. doi: 10.6065/apem.2018.23.4.182. Epub 2018 Dec 31. Ann Pediatr Endocrinol Metab. 2018. PMID: 30599479 Free PMC article. - Predictors of urinary phthalate biomarker concentrations in postmenopausal women.
Reeves KW, Santana MD, Manson JE, Hankinson SE, Zoeller RT, Bigelow C, Hou L, Wactawski-Wende J, Liu S, Tinker L, Calafat AM. Reeves KW, et al. Environ Res. 2019 Feb;169:122-130. doi: 10.1016/j.envres.2018.10.024. Epub 2018 Oct 30. Environ Res. 2019. PMID: 30447499 Free PMC article. - Association of endocrine disruptors and obesity: perspectives from epidemiological studies.
Hatch EE, Nelson JW, Stahlhut RW, Webster TF. Hatch EE, et al. Int J Androl. 2010 Apr;33(2):324-32. doi: 10.1111/j.1365-2605.2009.01035.x. Epub 2010 Jan 22. Int J Androl. 2010. PMID: 20113374 Free PMC article. Review. - Age and sex differences in childhood and adulthood obesity association with phthalates: analyses of NHANES 2007-2010.
Buser MC, Murray HE, Scinicariello F. Buser MC, et al. Int J Hyg Environ Health. 2014 Jul;217(6):687-94. doi: 10.1016/j.ijheh.2014.02.005. Epub 2014 Mar 5. Int J Hyg Environ Health. 2014. PMID: 24657244 Free PMC article. - Urinary phthalates and increased insulin resistance in adolescents.
Trasande L, Spanier AJ, Sathyanarayana S, Attina TM, Blustein J. Trasande L, et al. Pediatrics. 2013 Sep;132(3):e646-55. doi: 10.1542/peds.2012-4022. Epub 2013 Aug 19. Pediatrics. 2013. PMID: 23958772 Free PMC article.
References
Publication types
MeSH terms
Substances
LinkOut - more resources
Full Text Sources
Medical
Miscellaneous
