Using iterative cluster merging with improved gap statistics to perform online phenotype discovery in the context of high-throughput RNAi screens - PubMed (original) (raw)
Using iterative cluster merging with improved gap statistics to perform online phenotype discovery in the context of high-throughput RNAi screens
Zheng Yin et al. BMC Bioinformatics. 2008.
Abstract
Background: The recent emergence of high-throughput automated image acquisition technologies has forever changed how cell biologists collect and analyze data. Historically, the interpretation of cellular phenotypes in different experimental conditions has been dependent upon the expert opinions of well-trained biologists. Such qualitative analysis is particularly effective in detecting subtle, but important, deviations in phenotypes. However, while the rapid and continuing development of automated microscope-based technologies now facilitates the acquisition of trillions of cells in thousands of diverse experimental conditions, such as in the context of RNA interference (RNAi) or small-molecule screens, the massive size of these datasets precludes human analysis. Thus, the development of automated methods which aim to identify novel and biological relevant phenotypes online is one of the major challenges in high-throughput image-based screening. Ideally, phenotype discovery methods should be designed to utilize prior/existing information and tackle three challenging tasks, i.e. restoring pre-defined biological meaningful phenotypes, differentiating novel phenotypes from known ones and clarifying novel phenotypes from each other. Arbitrarily extracted information causes biased analysis, while combining the complete existing datasets with each new image is intractable in high-throughput screens.
Results: Here we present the design and implementation of a novel and robust online phenotype discovery method with broad applicability that can be used in diverse experimental contexts, especially high-throughput RNAi screens. This method features phenotype modelling and iterative cluster merging using improved gap statistics. A Gaussian Mixture Model (GMM) is employed to estimate the distribution of each existing phenotype, and then used as reference distribution in gap statistics. This method is broadly applicable to a number of different types of image-based datasets derived from a wide spectrum of experimental conditions and is suitable to adaptively process new images which are continuously added to existing datasets. Validations were carried out on different dataset, including published RNAi screening using Drosophila embryos [Additional files 1, 2], dataset for cell cycle phase identification using HeLa cells [Additional files 1, 3, 4] and synthetic dataset using polygons, our methods tackled three aforementioned tasks effectively with an accuracy range of 85%-90%. When our method is implemented in the context of a Drosophila genome-scale RNAi image-based screening of cultured cells aimed to identifying the contribution of individual genes towards the regulation of cell-shape, it efficiently discovers meaningful new phenotypes and provides novel biological insight. We also propose a two-step procedure to modify the novelty detection method based on one-class SVM, so that it can be used to online phenotype discovery. In different conditions, we compared the SVM based method with our method using various datasets and our methods consistently outperformed SVM based method in at least two of three tasks by 2% to 5%. These results demonstrate that our methods can be used to better identify novel phenotypes in image-based datasets from a wide range of conditions and organisms.
Conclusion: We demonstrate that our method can detect various novel phenotypes effectively in complex datasets. Experiment results also validate that our method performs consistently under different order of image input, variation of starting conditions including the number and composition of existing phenotypes, and dataset from different screens. In our findings, the proposed method is suitable for online phenotype discovery in diverse high-throughput image-based genetic and chemical screens.
Figures
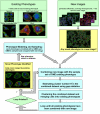
Figure 1
Tasks and simple scheme of online phenotype discovery.
Figure 2
Gap statistic curves for dataset with different sample number. Each curve represents experiment on one real dataset, and twenty reference datasets are defined from this real dataset. For each data point, value on X-axis indicates how many clusters are defined on both the reference dataset and the real dataset and value on Y-axis indicates gap statistic for this cluster number, which is defined as the average difference of within cluster dispersions between the clustering results on reference datasets and real dataset, the error bars around the data points show the variation across different reference datasets. The estimated cluster number is defined as the X value of the first data point with higher Y value than the bottom of error bar for its instant right neighbor. During the experiments, the "real" dataset consists of two clusters and different reference datasets are used, Left, uniform reference distribution are used, sample number differences are equal, 2-fold, 3-fold and 5-fold from bottom to top, gap statistics works; middle, uniform reference are used, sample number differences are 7-fold, 9-fold and 10-fold from bottom to top, gap statistic fails; right, two clusters having 10-fold difference in sample number, Gaussian distribution is used as reference distribution for the cluster with larger sample numbers, and the cluster number is estimated accurately.
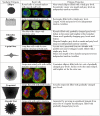
Figure 3
Information on seven polygon phenotypes used in simulation.
Figure 4
Performance of our method on synthetic datasets with different sets of existing phenotypes. For different number of "existing phenotypes" (X-axis), the performance on all seven types of polygons is summarized. Accuracy (Y-axis) indicates the ratio of test samples restored into its original clusters. All accuracy values are averaged across experiments with 50 different orders of image input and different composition of existing phenotypes (for number of existing phenotype 1–6, we have 7, 21, 35, 35, 21 and 7 different compositions, respectively).
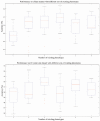
Figure 5
Box and whisker plots indicating the robustness of performance under different condition. The accuracy of each experiment is sorted in descending order and plotted on the Y-axis, the two horizontal edges of boxes indicate upper and lower quartile of accuracy values while the red line in the box body shows the median value. The whiskers and lines extending from the end of boxes show the extent of the rest data, and red crosses (+) are outliers with accuracy values beyond 1.5 times of inter quartile range. The performances on two polygon types are shown. Accuracy values of different experiments with different image input order but the same number of existing phenotypes are summarized in box and whisker plots. Upper, performance on ellipses phenotype; Lower, performance on 16-point stars phenotype.
Figure 6
Performance comparison between our methods and SVM based methods on two occasions. In each experiment, six polygon types are used as existing phenotypes. Accuracy denotes the ratio of samples restored to its original phenotypes. All the accuracy values are averaged across 100 tests having different order of image input. Four different sets of parameters are used for SVM based method. Left Ellipses serve as novel phenotype, the other six serve as existing phenotype; Right 16-point stars serve as novel phenotype.
Figure 7
Information of four existing phenotypes in training dataset.
Figure 8
Performance comparison between our method and SVM based methods with multiple phenotypes in images. Given certain group of existing phenotypes, and images including multiple phenotypes, the accuracy values for four phenotypes across 50 image input orders are shown. Four different sets of parameters are used for SVM based method. Left Normal and LPA as existing phenotypes; Middle Normal and CCA as existing phenotypes; Right Normal and Rho as existing phenotypes.
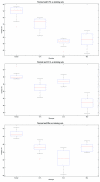
Figure 9
Box and whisker plots indicating the robustness of performance with multiple phenotypes in images. The accuracy of each experiment is sorted in descending order and plotted on the Y-axis, the two horizontal edges of boxes indicate upper and lower quartile of accuracy values while the red line in the box body shows the median value. The whiskers and lines extending from the end of boxes show the extent of the rest data, and red crosses (+) are outliers with accuracy values beyond 1.5 times of inter quartile range. Given certain group of existing phenotypes, and images including multiple phenotypes, the accuracy values for four phenotypes across 50 image input orders are shown. Top Normal and LPA are existing phenotypes; Middle Normal and CCA are existing phenotypes; Bottom Normal and Rho are existing phenotypes.
Figure 10
Information for the rl/tear-drop phenotype. "Typical cells" summarizes the properties of the _rl_-tear drop phenotype and "Typical image" shows an image with cells merged by _rl_-tear drop, LPA and Normal phenotype respectively.
Similar articles
- Online Phenotype Discovery based on Minimum Classification Error Model.
Yin Z, Zhou X, Sun Y, Wong ST. Yin Z, et al. Pattern Recognit. 2009 Apr;42(4):509-522. doi: 10.1016/j.patcog.2008.09.032. Pattern Recognit. 2009. PMID: 20161245 Free PMC article. - Towards automated cellular image segmentation for RNAi genome-wide screening.
Zhou X, Liu KY, Bradley P, Perrimon N, Wong ST. Zhou X, et al. Med Image Comput Comput Assist Interv. 2005;8(Pt 1):885-92. doi: 10.1007/11566465_109. Med Image Comput Comput Assist Interv. 2005. PMID: 16685930 - An image score inference system for RNAi genome-wide screening based on fuzzy mixture regression modeling.
Wang J, Zhou X, Li F, Bradley PL, Chang SF, Perrimon N, Wong ST. Wang J, et al. J Biomed Inform. 2009 Feb;42(1):32-40. doi: 10.1016/j.jbi.2008.04.007. Epub 2008 Apr 29. J Biomed Inform. 2009. PMID: 18547870 Free PMC article. - RNAi screening: new approaches, understandings, and organisms.
Mohr SE, Perrimon N. Mohr SE, et al. Wiley Interdiscip Rev RNA. 2012 Mar-Apr;3(2):145-58. doi: 10.1002/wrna.110. Epub 2011 Sep 22. Wiley Interdiscip Rev RNA. 2012. PMID: 21953743 Free PMC article. Review. - Cellular phenotyping by RNAi.
Fuchs F, Boutros M. Fuchs F, et al. Brief Funct Genomic Proteomic. 2006 Mar;5(1):52-6. doi: 10.1093/bfgp/ell007. Epub 2006 Feb 23. Brief Funct Genomic Proteomic. 2006. PMID: 16769679 Review.
Cited by
- Unleashing high content screening in hit detection - Benchmarking AI workflows including novelty detection.
Kupczyk E, Schorpp K, Hadian K, Lin S, Tziotis D, Schmitt-Kopplin P, Mueller C. Kupczyk E, et al. Comput Struct Biotechnol J. 2022 Sep 27;20:5453-5465. doi: 10.1016/j.csbj.2022.09.023. eCollection 2022. Comput Struct Biotechnol J. 2022. PMID: 36212538 Free PMC article. - Artificial intelligence unifies knowledge and actions in drug repositioning.
Yin Z, Wong STC. Yin Z, et al. Emerg Top Life Sci. 2021 Dec 21;5(6):803-813. doi: 10.1042/ETLS20210223. Emerg Top Life Sci. 2021. PMID: 34881780 Free PMC article. Review. - Using Two-dimensional Principal Component Analysis and Rotation Forest for Prediction of Protein-Protein Interactions.
Wang L, You ZH, Yan X, Xia SX, Liu F, Li LP, Zhang W, Zhou Y. Wang L, et al. Sci Rep. 2018 Aug 27;8(1):12874. doi: 10.1038/s41598-018-30694-1. Sci Rep. 2018. PMID: 30150728 Free PMC article. - A deep learning and novelty detection framework for rapid phenotyping in high-content screening.
Sommer C, Hoefler R, Samwer M, Gerlich DW. Sommer C, et al. Mol Biol Cell. 2017 Nov 7;28(23):3428-3436. doi: 10.1091/mbc.E17-05-0333. Epub 2017 Sep 27. Mol Biol Cell. 2017. PMID: 28954863 Free PMC article. - Ens-PPI: A Novel Ensemble Classifier for Predicting the Interactions of Proteins Using Autocovariance Transformation from PSSM.
Gao ZG, Wang L, Xia SX, You ZH, Yan X, Zhou Y. Gao ZG, et al. Biomed Res Int. 2016;2016:4563524. doi: 10.1155/2016/4563524. Epub 2016 Jun 29. Biomed Res Int. 2016. PMID: 27437399 Free PMC article.
References
- Friedman A, Perrimon N. functional genomic RNAi screen for novel regulators of RTK/ERK signaling. Nature. 2006;444:230–234. - PubMed
- Zhou X, Liu KY, Bradley P, Perrimon N, Wong STC. Towards automated cellular image segmentation for RNAi genome-wide screening. Lecture Notes in Computer Science (MICCAI 2005) pp. 885–892. - PubMed
- Xiong G, Zhou X, Ji L, Bradley P, Perrimon N, Wong STC. Automated segmentation of Drosophila RNAi fluorescence cellular images using deformable models. IEEE Transactions on Circuit and Systems. 2006;53:2415–2424.
- Li FH, Zhou X, Wong STC. An automated feedback system with the hybrid model of scoring and classification for solving over-segmentation problems in RNAi high content screening. Journal of Microscopy. 2007;226:121–132. - PubMed
Publication types
MeSH terms
Substances
LinkOut - more resources
Full Text Sources
Molecular Biology Databases
Miscellaneous


