Off-response property of an acid-activated cation channel complex PKD1L3-PKD2L1 - PubMed (original) (raw)
Off-response property of an acid-activated cation channel complex PKD1L3-PKD2L1
Hitoshi Inada et al. EMBO Rep. 2008 Jul.
Abstract
Ligand-gated ion channels are important in sensory and synaptic transduction. The PKD1L3-PKD2L1 channel complex is a sour taste receptor candidate that is activated by acids. Here, we report that the proton-activated PKD1L3-PKD2L1 ion channels have the unique ability to be activated after the removal of an acid stimulus. We refer to this property as the off-response (previously described as a delayed response). Electrophysiological analyses show that acid-induced responses are observed only after the removal of an acid solution at less than pH 3.0. A small increase in pH is sufficient for PKD1L3-PKD2L1 channel activation, after exposure to an acid at pH 2.5. These results indicate that this channel is a new type of ion channel-designated as an 'off-channel'-which is activated during stimulus application but not gated open until the removal of the stimulus. The off-response property of PKD1L3-PKD2L1 channels might explain the physiological phenomena occurring during sour taste sensation.
Conflict of interest statement
The authors declare that they have no conflict of interest.
Figures
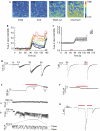
Figure 1
Off-response property of the PKD1L3–PKD2L1 channel. (A–C) Human embryonic kidney (HEK)293T cells expressing PKD1L3–PKD2L1 were exposed to an acid stimulus (25 mM citric acid; pH 2.8) for 15 s. (A) Changes in [Ca2+]i after acid exposure, as indicated by the fura-2 ratio with pseudocolour expression. (B,C) Profiles of the [Ca2+]i changes recorded for (B) selected individual cells and (C) average changes recorded among experiments (_n_=12). Red and black bars indicate acid and ionomycin exposure, respectively. (D–F) Patch-clamp analysis of HEK293T cells expressing PKD1L3–PKD2L1. (D) Whole-cell currents induced after removal of the acid stimulus after initial exposure for various durations. HEK293T cells were exposed to 25 mM citric acid (pH 2.8; red bars) at −60 mV for various durations (1–5 and 15 s). No off-response was induced on treatment with 25 mM citric acid neutralized to pH 7.4 (data not shown). (E) Single-channel currents induced after the removal of the acid stimulus in the outside-out configuration. Profiles recorded (a) during or (b) after acid exposure (red bar) are enlarged in the lower panels. A patch membrane was exposed to an acid (pH 2.5) at −60 mV for 5 s; the basal currents were reduced after acid exposure. (F) A representative current in the inside-out configuration. A patch membrane from PKD1L3–PKD21-expressing cells was exposed to an acid (pH 2.8) for 5 s (red bar) at +60 mV. (G) Inhibition of acid-induced whole-cell currents after acid re-exposure. HEK293T cells expressing PKD1L3–PKD2L1 channels were exposed to an acid (pH 2.5) at −60 mV for 10 s. On induction of a high-magnitude inward current after acid removal, an acid was re-applied for 8 s. Red bars indicate acid exposure.
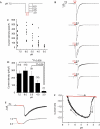
Figure 2
Ion selectivity of PKD1L3–PKD2L1 channels. (A) Representative activation profiles in the bath solution containing 140 mM NaCl, 110 mM CaCl2 or 110 mM MgCl2. Voltage ramp pulses (from −100 to +100 mV in 100 ms) were repeatedly applied at 1 s intervals for NaCl or 500 ms intervals for CaCl2 and MgCl2. Traces at the bottom indicate the pH of bath solution. (B) Current–voltage (I_–_V) relationship in the bath solution containing 140 mM NaCl, 110 mM CaCl2 or 110 mM MgCl2. Traces indicated by asterisks in (A) are presented. The acidic and neutral solution compositions are described in the supplementary information online.
Figure 3
Acid specificity and threshold pH for PKD1L3–PKD2L1 channel activation. (A) Current-density distribution on application of various acids, including HCl, H2SO4, citric acid (CA), malic acid (MA), phosphoric acid (PA), succinic acid (SA) and tartaric acid (TA). The pH of all the acids, except SA (pH 2.6), was adjusted to 2.5. The acidic and neutral solution compositions are described in the supplementary information online. Cells expressing PKD1L3–PKD2L1 channels were exposed to acid solutions at pH 2.5 for 5 s. (B) Average current densities induced by various acid solutions. Error bars and the values in parentheses indicate the s.e.m. and number of cells, respectively. (C) Current-density distribution induced by acids at various pH values. Cells expressing PKD1L3–PKD2L1 channels were exposed to acids at various pH values (2.5, 2.75, 3.0, 3.5 or 4.0) for 5 s each (inset). (D) Average current densities induced by the acid solutions at various pH values. Error bars and values in parentheses indicate the s.e.m. and number of cells, respectively.
Figure 4
pH dependency of PKD1L3–PKD2L1 channel activation after acid exposure. (A) Cells expressing PKD1L3–PKD2L1 channels were exposed to an acid at pH 2.5 for 5 s and then to solutions at various pH values (3.0, 4.0, 5.0, 6.0 or 7.5) for 5 s each toward neutralization (pH 7.5). (B) Representative whole-cell current profiles obtained by the protocol described in (A). Red and black bars represent treatment with the acid at pH 2.5 and with solutions at various pH values, respectively. (C) Distribution and (D) average of the current densities induced by treatment with the second solutions at various pH values. Error bars and values in parentheses indicate the s.e.m. and number of cells, respectively. (E) A representative citric acid-induced current (upper) with corresponding pH (bottom). Red parts indicate a current during the acid application. (F) A representative pH-response profile made from traces in (E). The red part indicates acid application shown in (E). Arrows indicate time course of current–pH relationship.
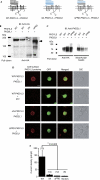
Figure 5
Deletion analysis of the amino-terminal region of the PKD1L3 protein. (A) Predicted structure of PKD1L3 deletion mutants. Either the entire N-terminal sequence (1,068 amino acids (aa)) or a part of it, including the proline–serine (Pro–Ser)-rich domain (499 aa; shown in blue) was deleted (ΔN and ΔPRD, respectively). The Pro/Ser-rich domain and the PKD homology domain are indicated as a dotted line and an oval, respectively. PKD2L1 contains six transmembrane domains with a putative pore-forming region. (B–D) Surface expression of the PKD1L3 deletion mutants and their interaction with PKD2L1. (B) Membrane proteins were prepared from human embryonic kidney (HEK)293T cells expressing haemagglutinin (HA)-tagged wild-type PKD1L3 (WT) and the deletion mutants (ΔN and ΔPRD) in the presence of PKD2L1. After immunoprecipitation with an HA antibody, the PKD1L3 proteins were detected using an HA antibody. The open and filled arrowheads indicate HA-tagged wild-type PKD1L3 and the deletion mutants, respectively. (C) Association between HA-tagged wild-type PKD1L3 (WT) or the deletion mutants (ΔN and ΔPRD) and the PKD2L1 protein was confirmed by a pull-down assay. The HA-tagged PKD1L3 proteins were co-immunoprecipitated with the PKD2L1 proteins. Furthermore, the cell-surface expression of PKD2L1 was confirmed by a cell-surface biotinylation. (D) The surface expressions of the PKD1L3 deletion mutants were confirmed by immunostaining by using a confocal microscope. HEK293T cells expressing HA-tagged wild-type PKD1L3 (WT-PKD1L3) and the deletion mutants (ΔN-PKD1L3 and ΔPRD-PKD1L3) in the presence of PKD2L1 were stained with HA antibodies under non-permeabilizing conditions (scale bar, 10 μm). HEK293T cells expressing wild-type PKD1L3 in the absence of PKD2L1 were stained under the same conditions as the negative control. (E) Average current densities induced by treatment with an acid solution at pH 2.5 for 5 s in HEK293T cells expressing wild-type PKD1L3 (WT) or the deletion mutants (ΔN and ΔPRD) in the presence of PKD2L1. The vectors control indicates the data obtained from cells transfected with pDisplay/pCI. Error bars and values in parentheses indicate the s.e.m. and number of cells, respectively. The details are described in the supplementary information online. DIC, differential interference contrast; GFP, green fluorescent protein.
Similar articles
- Activation of polycystic kidney disease-2-like 1 (PKD2L1)-PKD1L3 complex by acid in mouse taste cells.
Kawaguchi H, Yamanaka A, Uchida K, Shibasaki K, Sokabe T, Maruyama Y, Yanagawa Y, Murakami S, Tominaga M. Kawaguchi H, et al. J Biol Chem. 2010 Jun 4;285(23):17277-81. doi: 10.1074/jbc.C110.132944. Epub 2010 Apr 20. J Biol Chem. 2010. PMID: 20406802 Free PMC article. - The response of PKD1L3/PKD2L1 to acid stimuli is inhibited by capsaicin and its pungent analogs.
Ishii S, Kurokawa A, Kishi M, Yamagami K, Okada S, Ishimaru Y, Misaka T. Ishii S, et al. FEBS J. 2012 May;279(10):1857-70. doi: 10.1111/j.1742-4658.2012.08566.x. Epub 2012 Apr 16. FEBS J. 2012. PMID: 22420714 Free PMC article. - The single pore residue Asp523 in PKD2L1 determines Ca2+ permeation of the PKD1L3/PKD2L1 complex.
Fujimoto C, Ishimaru Y, Katano Y, Misaka T, Yamasoba T, Asakura T, Abe K. Fujimoto C, et al. Biochem Biophys Res Commun. 2011 Jan 28;404(4):946-51. doi: 10.1016/j.bbrc.2010.12.086. Epub 2010 Dec 23. Biochem Biophys Res Commun. 2011. PMID: 21185261 - Molecular mechanisms underlying the reception and transmission of sour taste information.
Ishimaru Y. Ishimaru Y. Biosci Biotechnol Biochem. 2015;79(2):171-6. doi: 10.1080/09168451.2014.975187. Epub 2014 Nov 26. Biosci Biotechnol Biochem. 2015. PMID: 25424843 Review.
Cited by
- Sensory detection and responses to toxic gases: mechanisms, health effects, and countermeasures.
Bessac BF, Jordt SE. Bessac BF, et al. Proc Am Thorac Soc. 2010 Jul;7(4):269-77. doi: 10.1513/pats.201001-004SM. Proc Am Thorac Soc. 2010. PMID: 20601631 Free PMC article. Review. - A PKD1L3 splice variant in taste buds is not cleaved at the G protein-coupled receptor proteolytic site.
Kashyap P, Ng C, Wang Z, Li B, Arif Pavel M, Martin H, Yu Y. Kashyap P, et al. Biochem Biophys Res Commun. 2019 May 14;512(4):812-818. doi: 10.1016/j.bbrc.2019.03.099. Epub 2019 Mar 27. Biochem Biophys Res Commun. 2019. PMID: 30928102 Free PMC article. - Primary processes in sensory cells: current advances.
Frings S. Frings S. J Comp Physiol A Neuroethol Sens Neural Behav Physiol. 2009 Jan;195(1):1-19. doi: 10.1007/s00359-008-0389-0. Epub 2008 Nov 15. J Comp Physiol A Neuroethol Sens Neural Behav Physiol. 2009. PMID: 19011871 Review. - Arterial Spin Labeling Imaging for the Parotid Glands of Patients with Sjögren's Syndrome.
Kami YN, Sumi M, Takagi Y, Sasaki M, Uetani M, Nakamura T. Kami YN, et al. PLoS One. 2016 Mar 9;11(3):e0150680. doi: 10.1371/journal.pone.0150680. eCollection 2016. PLoS One. 2016. PMID: 26959680 Free PMC article. - Adaptive selection drives TRPP3 loss-of-function in an Ethiopian population.
Walsh S, Izquierdo-Serra M, Acosta S, Edo A, Lloret M, Moret R, Bosch E, Oliva B, Bertranpetit J, Fernández-Fernández JM. Walsh S, et al. Sci Rep. 2020 Dec 2;10(1):20999. doi: 10.1038/s41598-020-78081-z. Sci Rep. 2020. PMID: 33268808 Free PMC article.
References
- Chen XZ, Vassilev PM, Basora N, Peng JB, Nomura H, Segal Y, Brown EM, Reeders ST, Hediger MA, Zhou J (1999) Polycystin-L is a calcium-regulated cation channel permeable to calcium ions. Nature 401: 383–386 - PubMed
- Danilova V, Danilov Y, Roberts T, Tinti JM, Nofre C, Hellekant G (2002) Sense of taste in a New World monkey, the common marmoset: recordings from the chorda tympani and glossopharyngeal nerves. J Neurophysiol 88: 579–594 - PubMed
- DeSimone JA, Callaham EM, Heck GL (1995) Chorda tympani taste response of rat to hydrochloric acid subject to voltage-clamped lingual receptive field. Am J Physiol 268: C1295–C1300 - PubMed
- Hodson NA, Linden RW (2006) The effect of monosodium glutamate on parotid salivary flow in comparison to the response to representatives of the other four basic tastes. Physiol Behav 89: 711–717 - PubMed
Publication types
MeSH terms
Substances
LinkOut - more resources
Full Text Sources
Molecular Biology Databases


