Convergence and extension at gastrulation require a myosin IIB-dependent cortical actin network - PubMed (original) (raw)
. 2008 Aug;135(14):2435-44.
doi: 10.1242/dev.014704. Epub 2008 Jun 11.
Affiliations
- PMID: 18550716
- PMCID: PMC2735133
- DOI: 10.1242/dev.014704
Convergence and extension at gastrulation require a myosin IIB-dependent cortical actin network
Paul Skoglund et al. Development. 2008 Aug.
Abstract
Force-producing convergence (narrowing) and extension (lengthening) of tissues by active intercalation of cells along the axis of convergence play a major role in axial morphogenesis during embryo development in both vertebrates and invertebrates, and failure of these processes in human embryos leads to defects including spina bifida and anencephaly. Here we use Xenopus laevis, a system in which the polarized cell motility that drives this active cell intercalation has been related to the development of forces that close the blastopore and elongate the body axis, to examine the role of myosin IIB in convergence and extension. We find that myosin IIB is localized in the cortex of intercalating cells, and show by morpholino knockdown that this myosin isoform is essential for the maintenance of a stereotypical, cortical actin cytoskeleton as visualized with time-lapse fluorescent confocal microscopy. We show that this actin network consists of foci or nodes connected by cables and is polarized relative to the embryonic axis, preferentially cyclically shortening and lengthening parallel to the axis of cell polarization, elongation and intercalation, and also parallel to the axis of convergence forces during gastrulation. Depletion of MHC-B results in disruption of this polarized cytoskeleton, loss of the polarized protrusive activity characteristic of intercalating cells, eventual loss of cell-cell and cell-matrix adhesion, and dose-dependent failure of blastopore closure, arguably because of failure to develop convergence forces parallel to the myosin IIB-dependent dynamics of the actin cytoskeleton. These findings bridge the gap between a molecular-scale motor protein and tissue-scale embryonic morphogenesis.
Figures
Figure 1
MHC-B protein is localized to the dorsal axis (A), both at the surfaces of the somites (B) and in a polarized distribution in mature notochord (C). Posterior notochordal cells actively undergoing CE exhibit MHC-B localized to triple cell junctions inside the notochord (*) where invasive protrusions extend between adjacent cells during intercalation, and at cell-cell-matrix junctions at the notochord-somite boundary (pointers in D). Basal (mesodermal side) view of MHC-B staining in a deep neural-over-mesoderm explant reveals MHC-B to exhibit a fibrillar distribution over notochord and somites (E). Scale bars are 500 μm, except in D at 50 μm. N is notochord, S is somitic mesoderm and NSB is notochordal-somitic boundary.
Figure 2
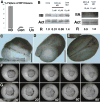
Percent of embryos failing to close the blastopore is plotted for 10 μM IIBMO (n = 74), 10 μM control (n = 72) and uninjected (n = 84) embryos, with SEM (standard error of the mean)(A). Western blots showing MHC-B (IIB), MHC-A (IIA) and actin (Act) levels in uninjected, 5 μM and10 μM morpholino, and 10 μM control morpholino embryos. The normalized ratio of MHC-B or MHC-A to Actin (R) is also shown (B). A representative morphant embryo (C), a unilaterally (right-side)-morphant embryo (D), and a control embryo (E) at stage 19 are shown. Time-lapse movie frames show the vegetal (blastopore) view of development of a 10 μM morphant (F) and a 10 μM control embryo (G) with time in minutes shown. Insets show bottle cells. Scale bars are 500 μm, except in D at 1 mm.
Figure 3
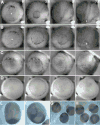
Still images from simultaneous time-lapse videorecordings show vegetal views of control (A) and morphant embryos injected with 2.5 μM (B), 5 μM (C), and 10 μM (D) MHC-B MO. All embryos are oriented with their dorsal side up. At stage 10+−10 1/4 (t=0) bottle cells form in the dorsal lip of the blastopore of all control and morphant embryos. By control stage 12 (t=2.5) ventral bottle cells have formed in all control and morphant embryos, but blastopore closure is delayed in a dose-dependent manner. The site of blastopore closure in 2.5μM (B, t=7.5) morphant embryos is not located as ventrally as in control embryos (A, t=7.5). RNA in situ hybridizations of stage 13 embryos for brachyury expression reveals the extent of notochordal morphogenesis in a control embryo (E), and reduced notochordal morphogenesis in a 5 μM morphant (F). The 5 μM morphant embryos exhibit some variability in notochordal extension (G), but 10 μM morphant embryos have essentially no notochord extended (H).
Figure 4
Explanting the dorsal tissues of a neurula above the blastopore (Bp) and removing the endodermal archenteron roof (ar) exposes the notochord (N) and somitic mesoderm (S) for imaging during CE (A). In such explants confocal time-lapse imaging of a notochord mosaic for cells injected with 5μM MHC-B morpholino reveals that morphant cells (labelled) in the background of a notochord expressing a membrane bound GFP (revealing cell outlines) shows the loss of regulation of polarized cell motility (B). An epi-fluorescent time-lapse sequence of these cells exhibit aberrant cell motile behaviors and eventually are excluded from the notochord (C). Control notochordal cells at or near the notochord-somite boundary (NSB) exhibit monopolar motile behaviors, with few protrusions toward the notochord-somite boundary, while 5 μM morphant cells both express increased motility, and improperly direct this motility towards the boundary (D). One unit represents six percent of the total protrusive activity directed towards that sector, and is each sector is oriented relative to the notochord-somite boundary. Asterisks represent the notochord-somite boundary, and scale bars are 50 microns.
Figure 5
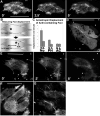
Confocal microscopy of control cells injected with moesin-GFP reveals a dynamic cortical actin network in a basket-like distribution, with 3–5 foci of actin visible per cell (A). These actin-rich foci visibly move within the cell on a sub- minute timescale (astericks in A). Plotting the relative displacement of foci along the embryonic axis, both the medial-lateral direction and the anterior-posterior direction (B), reveals that the rate of displacement of these foci is greater in the medial-lateral (M) dimension that in the anterior-posterior dimension (A) for notochordal cells (No) (p<0.02 by students t-test), and this polarity is detectable in pre-notochordal cells (PN) but not in animal cap cells (AC) (C). In contrast to control cells, MHC-B injected cells reveal dramatic disruption of the cortical actin network (D). Confocal time-lapse sequence of a morphant cell exhibiting aberrant motility concomitant with cortical actin breakdown (E). Asterisks indicate notochord-somite boundary, and elapsed time is shown in minutes. Mildly morphant notochordal cells (1 μM MO) remain in notochord with intact cortical actin networks, but exhibit profuse filopodia (E) relative to control notochordal cells (F), revealing a threshold cell polarity phenotype in response to MHC-B depletion. Asterisks represent the notochord-somite boundary, and scale bars are 50 microns.
Figure 6
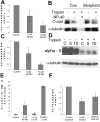
Morphant dorsal axial cells at St. 13 exhibit a dramatic dose-dependent reduction in adhesion to recombinant extracellular domain of C-cadherin (A). However, cell surface levels of C-Cad are unchanged in morphant cells, because similar levels of control and morphant cell C-Cad is available on the cell surface for trypsin digestion (B). Morphant cells also show a dramatic reduction in adhesion to fibronectin (FN) (C), and integrin α5 surface levels also are not affected by myosin IIB depletion (D). Failure of blastopore closure due to MHC-B depletion is not rescued by exogenous expression of C-Cad, consistent with the hypothesis that C-Cad levels are not limiting in morphant embryos (E). Adhesion to FN in morphant cells is rescued by co-expression of exogenous human MHC-B (F).
Figure 7
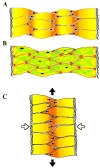
Cell intercalation in the notochord requires two distinct cell activities, cell contraction in the cell body (grey arrows in A) and polarized protrusive activity (black arrows). Contraction events are driven by the myosin IIB-dependent cortical actin network (green lines in B) organized into dynamic foci (purple), and interacting with myosin IIB at adhesion sites (red). Integrating this episodic cell shortening with polarized protrusive activity and dynamically regulated myosin IIB-dependent adhesion leads to cell intercalation (white arrows in C) and tissue level convergence and extension (black arrows). The extracellular matrix of the notochord-somite boundary is lateral in each case.
Similar articles
- Molecular model for force production and transmission during vertebrate gastrulation.
Pfister K, Shook DR, Chang C, Keller R, Skoglund P. Pfister K, et al. Development. 2016 Feb 15;143(4):715-27. doi: 10.1242/dev.128090. Development. 2016. PMID: 26884399 Free PMC article. - Morphogenetic movements driving neural tube closure in Xenopus require myosin IIB.
Rolo A, Skoglund P, Keller R. Rolo A, et al. Dev Biol. 2009 Mar 15;327(2):327-38. doi: 10.1016/j.ydbio.2008.12.009. Epub 2008 Dec 24. Dev Biol. 2009. PMID: 19121300 Free PMC article. - Directional migration of leading-edge mesoderm generates physical forces: Implication in Xenopus notochord formation during gastrulation.
Hara Y, Nagayama K, Yamamoto TS, Matsumoto T, Suzuki M, Ueno N. Hara Y, et al. Dev Biol. 2013 Oct 15;382(2):482-95. doi: 10.1016/j.ydbio.2013.07.023. Epub 2013 Aug 6. Dev Biol. 2013. PMID: 23933171 - Nonmuscle myosin-2: mix and match.
Heissler SM, Manstein DJ. Heissler SM, et al. Cell Mol Life Sci. 2013 Jan;70(1):1-21. doi: 10.1007/s00018-012-1002-9. Epub 2012 May 8. Cell Mol Life Sci. 2013. PMID: 22565821 Free PMC article. Review. - Mesoderm and endoderm internalization in the Xenopus gastrula.
Winklbauer R. Winklbauer R. Curr Top Dev Biol. 2020;136:243-270. doi: 10.1016/bs.ctdb.2019.09.002. Epub 2019 Nov 5. Curr Top Dev Biol. 2020. PMID: 31959290 Review.
Cited by
- Traction forces mediated by integrin signaling are necessary for definitive endoderm specification.
Taylor-Weiner H, Ravi N, Engler AJ. Taylor-Weiner H, et al. J Cell Sci. 2015 May 15;128(10):1961-8. doi: 10.1242/jcs.166157. Epub 2015 Apr 23. J Cell Sci. 2015. PMID: 25908864 Free PMC article. - Spindle position in symmetric cell divisions during epiboly is controlled by opposing and dynamic apicobasal forces.
Woolner S, Papalopulu N. Woolner S, et al. Dev Cell. 2012 Apr 17;22(4):775-87. doi: 10.1016/j.devcel.2012.01.002. Epub 2012 Mar 8. Dev Cell. 2012. PMID: 22406140 Free PMC article. - Novel roles of the chemorepellent axon guidance molecule RGMa in cell migration and adhesion.
Lah GJ, Key B. Lah GJ, et al. Mol Cell Biol. 2012 Mar;32(5):968-80. doi: 10.1128/MCB.06128-11. Epub 2012 Jan 3. Mol Cell Biol. 2012. PMID: 22215618 Free PMC article. - Convergent extension in mammalian morphogenesis.
Sutherland A, Keller R, Lesko A. Sutherland A, et al. Semin Cell Dev Biol. 2020 Apr;100:199-211. doi: 10.1016/j.semcdb.2019.11.002. Epub 2019 Nov 13. Semin Cell Dev Biol. 2020. PMID: 31734039 Free PMC article. Review. - Coming to Consensus: A Unifying Model Emerges for Convergent Extension.
Huebner RJ, Wallingford JB. Huebner RJ, et al. Dev Cell. 2018 Aug 20;46(4):389-396. doi: 10.1016/j.devcel.2018.08.003. Dev Cell. 2018. PMID: 30130529 Free PMC article. Review.
References
- Amaya E, Stein PA, Musci TJ, Kirschner MW. FGF signalling in the early specification of mesoderm in Xenopus. Development. 1993;118:477–87. - PubMed
- Beningo KA, Lo CM, Wang YL. Flexible polyacrylamide substrata for the analysis of mechanical interactions at cell-substratum adhesions. Methods Cell Biol. 2002;69:325–39. - PubMed
- Beningo KA, Wang YL. Flexible substrata for the detection of cellular traction forces. Trends Cell Biol. 2002;12:79–84. - PubMed
- Bertet C, Sulak L, Lecuit T. Myosin-dependent junction remodelling controls planar cell intercalation and axis elongation. Nature. 2004;429:667–71. - PubMed
Publication types
MeSH terms
Substances
Grants and funding
- R01 HD025594/HD/NICHD NIH HHS/United States
- R37 HD025594/HD/NICHD NIH HHS/United States
- R37 HD025594-19/HD/NICHD NIH HHS/United States
- HD36426-01/HD/NICHD NIH HHS/United States
- HD25594-13/HD/NICHD NIH HHS/United States
LinkOut - more resources
Full Text Sources
Research Materials
Miscellaneous

