RNA-seq: an assessment of technical reproducibility and comparison with gene expression arrays - PubMed (original) (raw)
Comparative Study
. 2008 Sep;18(9):1509-17.
doi: 10.1101/gr.079558.108. Epub 2008 Jun 11.
Affiliations
- PMID: 18550803
- PMCID: PMC2527709
- DOI: 10.1101/gr.079558.108
Comparative Study
RNA-seq: an assessment of technical reproducibility and comparison with gene expression arrays
John C Marioni et al. Genome Res. 2008 Sep.
Abstract
Ultra-high-throughput sequencing is emerging as an attractive alternative to microarrays for genotyping, analysis of methylation patterns, and identification of transcription factor binding sites. Here, we describe an application of the Illumina sequencing (formerly Solexa sequencing) platform to study mRNA expression levels. Our goals were to estimate technical variance associated with Illumina sequencing in this context and to compare its ability to identify differentially expressed genes with existing array technologies. To do so, we estimated gene expression differences between liver and kidney RNA samples using multiple sequencing replicates, and compared the sequencing data to results obtained from Affymetrix arrays using the same RNA samples. We find that the Illumina sequencing data are highly replicable, with relatively little technical variation, and thus, for many purposes, it may suffice to sequence each mRNA sample only once (i.e., using one lane). The information in a single lane of Illumina sequencing data appears comparable to that in a single array in enabling identification of differentially expressed genes, while allowing for additional analyses such as detection of low-expressed genes, alternative splice variants, and novel transcripts. Based on our observations, we propose an empirical protocol and a statistical framework for the analysis of gene expression using ultra-high-throughput sequencing technology.
Figures
Figure 1.
Graphical representation of the study design. (A) Summary of the experimental design. (B) The lanes in which each sample was sequenced across the two runs. In each run, the control sample was sequenced in lane 5. Samples were sequenced at two concentrations: 1.5 pM (indicated by an asterisk) and 3 pM (no asterisk).
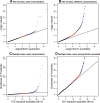
Figure 2.
Plots to assess lane effects. Each panel shows a _qq_-plot comparing the distribution of a statistic (_Y_-axis) against its theoretical distribution in the absence of a lane effect (_X_-axis). Deviations from the line y = x indicate the presence of a lane effect. (Points in red) Those above the 95th percentile; (points in blue) those above the 99.5th percentile. (A) A typical result when using _P_-values derived from a hypergeometric test statistic to compare two lanes used to sequence the same sample at the same concentration. (In this panel, data generated when the kidney sample was sequenced in Run 1, lane 1 and Run 2, lane 2 were used; see Supplemental Fig. 4 for all pairwise comparisons.) (B) Analogous results when comparing two lanes used to sequence the same sample at different concentrations. (In this panel, data generated when the kidney sample was sequenced in Run 1, lane 1 and Run 2, lane 4 were used; see Supplemental Fig. 5 for all pairwise comparisons.) (C,D) Results (on two different scales) when the goodness-of-fit statistic is used to assess the fit of the Poisson model to the kidney data sequenced at a concentration of 3 pM. The liver sample showed a similar pattern (Supplemental Fig. 6).
Figure 3.
Comparing counts from Illumina sequencing with normalized intensities from the array, for kidney (left) and liver (right). In each panel, the average (log2) counts for each gene are plotted on the _X_-axis, and the corresponding normalized intensities from the array are shown on the _Y-_axis. To avoid taking the log of 0, we added 1 to each of the average counts prior to taking logs.
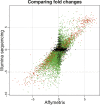
Figure 4.
Comparison of estimated log2 fold changes (liver/kidney) from Illumina (_Y_-axis) and Affymetrix (_X_-axis). We consider only genes that were interrogated using both platforms and genes where the mean number of counts across lanes was greater than 0 for both the liver and kidney samples. (Red and green dots) Genes called as differentially expressed based on the Illumina sequencing data at an FDR of 0.1%, with a mean number of counts greater than (red) or less than (green) 250 reads in both tissues. (Black dots) Genes not called as differentially expressed based on the Illumina sequencing data. The set of differentially expressed genes that show the strongest correlation between the two technologies seems to be those that are mapped to by many reads (red), while the correlation is weaker for differentially expressed genes mapped to by fewer reads (green).
Figure 5.
A Venn diagram summarizing the overlap between genes called as differentially expressed from the (left circle) sequence data and from the (right circle) array. The number of genes called by both technologies is indicated by the overlap between the two circles.
Figure 6.
An example of alternative splicing. The full exon structure of C17orf45 (ENSG00000175061) is shown for kidney (top) and liver (bottom), with exons plotted to scale. (Black) The number of reads mapping to each exon and to each exon junction. (Gray) The number of reads mapping to alternative splice exon junctions (i.e., junctions between non-consecutive exons). (The black lines below the exon) The location of reads mapped to this gene in Run 2, lane 2 (kidney) and Run 2, lane 3 (liver).
Similar articles
- A systematic comparison and evaluation of high density exon arrays and RNA-seq technology used to unravel the peripheral blood transcriptome of sickle cell disease.
Raghavachari N, Barb J, Yang Y, Liu P, Woodhouse K, Levy D, O'Donnell CJ, Munson PJ, Kato GJ. Raghavachari N, et al. BMC Med Genomics. 2012 Jun 29;5:28. doi: 10.1186/1755-8794-5-28. BMC Med Genomics. 2012. PMID: 22747986 Free PMC article. - Evaluating gene expression in C57BL/6J and DBA/2J mouse striatum using RNA-Seq and microarrays.
Bottomly D, Walter NA, Hunter JE, Darakjian P, Kawane S, Buck KJ, Searles RP, Mooney M, McWeeney SK, Hitzemann R. Bottomly D, et al. PLoS One. 2011 Mar 24;6(3):e17820. doi: 10.1371/journal.pone.0017820. PLoS One. 2011. PMID: 21455293 Free PMC article. - Estimating accuracy of RNA-Seq and microarrays with proteomics.
Fu X, Fu N, Guo S, Yan Z, Xu Y, Hu H, Menzel C, Chen W, Li Y, Zeng R, Khaitovich P. Fu X, et al. BMC Genomics. 2009 Apr 16;10:161. doi: 10.1186/1471-2164-10-161. BMC Genomics. 2009. PMID: 19371429 Free PMC article. - Statistical detection of differentially expressed genes based on RNA-seq: from biological to phylogenetic replicates.
Gu X. Gu X. Brief Bioinform. 2016 Mar;17(2):243-8. doi: 10.1093/bib/bbv035. Epub 2015 Jun 24. Brief Bioinform. 2016. PMID: 26108230 Review. - Microarrays, deep sequencing and the true measure of the transcriptome.
Malone JH, Oliver B. Malone JH, et al. BMC Biol. 2011 May 31;9:34. doi: 10.1186/1741-7007-9-34. BMC Biol. 2011. PMID: 21627854 Free PMC article. Review.
Cited by
- Transcriptome analysis of mammary epithelial cell between Sewa sheep and East FriEsian sheep from different localities.
Li R, Pan J, Pan C, Li J, Zhang Z, Shahzad K, Sun Y, Yixi Q, Zhaxi W, Qing H, Song T, Zhao W. Li R, et al. BMC Genomics. 2024 Nov 5;25(1):1038. doi: 10.1186/s12864-024-10946-3. BMC Genomics. 2024. PMID: 39501165 Free PMC article. - A preliminary study of gene expression changes in Koalas Infected with Koala Retrovirus (KoRV) and identification of potential biomarkers for KoRV pathogenesis.
Akter L, Hashem MA, Kayesh MEH, Hossain MA, Maetani F, Akhter R, Hossain KA, Rashid MHO, Sakurai H, Asai T, Hoque MN, Tsukiyama-Kohara K. Akter L, et al. BMC Vet Res. 2024 Oct 30;20(1):496. doi: 10.1186/s12917-024-04357-5. BMC Vet Res. 2024. PMID: 39478576 Free PMC article. - Machine Learning Analysis of RNA-Seq Data Identifies Key Gene Signatures and Pathways in Mpox Virus-Induced Gastrointestinal Complications Using Colon Organoid Models.
Rezapour M, Narayanan A, Gurcan MN. Rezapour M, et al. Int J Mol Sci. 2024 Oct 17;25(20):11142. doi: 10.3390/ijms252011142. Int J Mol Sci. 2024. PMID: 39456924 Free PMC article. - Effect of Gossypol on Gene Expression in Swine Granulosa Cells.
Hong MW, Kim H, Choi SY, Sharma N, Lee SJ. Hong MW, et al. Toxins (Basel). 2024 Oct 10;16(10):436. doi: 10.3390/toxins16100436. Toxins (Basel). 2024. PMID: 39453212 Free PMC article. - Single-cell profiling of cellular changes in the somatic peripheral nerves following nerve injury.
Zhao L, Jiang C, Yu B, Zhu J, Sun Y, Yi S. Zhao L, et al. Front Pharmacol. 2024 Oct 2;15:1448253. doi: 10.3389/fphar.2024.1448253. eCollection 2024. Front Pharmacol. 2024. PMID: 39415832 Free PMC article. Review.
References
- Allison D., Cui X., Page G., Sabripour M., Cui X., Page G., Sabripour M., Page G., Sabripour M., Sabripour M. Microarray data analysis: From disarray to consolidation and consensus. Nat. Rev. Genet. 2006;7:55–65. - PubMed
- Bennett S., Barnes C., Cox A., Davies L., Brown C., Barnes C., Cox A., Davies L., Brown C., Cox A., Davies L., Brown C., Davies L., Brown C., Brown C. Toward the 1,000 dollars human genome. Pharmacogenomics. 2005;6:373–382. - PubMed
- Cokus S., Feng S., Zhang X., Chen Z., Merriman B., Haudenschild C., Pradhan S., Nelson S., Pellegrini M., Jacobsen S., Feng S., Zhang X., Chen Z., Merriman B., Haudenschild C., Pradhan S., Nelson S., Pellegrini M., Jacobsen S., Zhang X., Chen Z., Merriman B., Haudenschild C., Pradhan S., Nelson S., Pellegrini M., Jacobsen S., Chen Z., Merriman B., Haudenschild C., Pradhan S., Nelson S., Pellegrini M., Jacobsen S., Merriman B., Haudenschild C., Pradhan S., Nelson S., Pellegrini M., Jacobsen S., Haudenschild C., Pradhan S., Nelson S., Pellegrini M., Jacobsen S., Pradhan S., Nelson S., Pellegrini M., Jacobsen S., Nelson S., Pellegrini M., Jacobsen S., Pellegrini M., Jacobsen S., Jacobsen S. Shotgun bisulphite sequencing of the Arabidopsis genome reveals DNA methylation patterning. Nature. 2008;452:215–219. - PMC - PubMed
- de Jonge H., Fehrmann R., de Bont E., Hofstra R., Gerbens F., Kamps W., de Vries E., van der Zee A., te Meerman G., ter Elst A., Fehrmann R., de Bont E., Hofstra R., Gerbens F., Kamps W., de Vries E., van der Zee A., te Meerman G., ter Elst A., de Bont E., Hofstra R., Gerbens F., Kamps W., de Vries E., van der Zee A., te Meerman G., ter Elst A., Hofstra R., Gerbens F., Kamps W., de Vries E., van der Zee A., te Meerman G., ter Elst A., Gerbens F., Kamps W., de Vries E., van der Zee A., te Meerman G., ter Elst A., Kamps W., de Vries E., van der Zee A., te Meerman G., ter Elst A., de Vries E., van der Zee A., te Meerman G., ter Elst A., van der Zee A., te Meerman G., ter Elst A., te Meerman G., ter Elst A., ter Elst A. Evidence based selection of housekeeping genes. PLoS One. 2007;2:e898. doi: 10.1371/journal.pone.0000898. - DOI - PMC - PubMed
Publication types
MeSH terms
Substances
Grants and funding
- U24 NS051869/NS/NINDS NIH HHS/United States
- R01 HG002585/HG/NHGRI NIH HHS/United States
- GM077959/GM/NIGMS NIH HHS/United States
- HG002585/HG/NHGRI NIH HHS/United States
- R01 GM077959/GM/NIGMS NIH HHS/United States
LinkOut - more resources
Full Text Sources
Other Literature Sources


