Stereotaxic probabilistic maps of the magnocellular cell groups in human basal forebrain - PubMed (original) (raw)
Stereotaxic probabilistic maps of the magnocellular cell groups in human basal forebrain
Laszlo Zaborszky et al. Neuroimage. 2008.
Abstract
The basal forebrain contains several interdigitating anatomical structures, including the diagonal band of Broca, the basal nucleus of Meynert, the ventral striatum, and also cell groups underneath the globus pallidus that bridge the centromedial amygdala to the bed nucleus of the stria terminalis. Among the cell populations, the magnocellular, cholinergic corticopetal projection neurons have received particular attention due to their loss in Alzheimer's disease. In MRI images, the precise delineation of these structures is difficult due to limited spatial resolution and contrast. Here, using microscopic delineations in ten human postmortem brains, we present stereotaxic probabilistic maps of the basal forebrain areas containing the magnocellular cell groups. Cytoarchitectonic mapping was performed in silver stained histological serial sections. The positions and the extent of the magnocellular cell groups within the septum (Ch1-2), the horizontal limb of the diagonal band (Ch3), and in the sublenticular part of the basal forebrain (Ch4) were traced in high-resolution digitized histological sections, 3D reconstructed, and warped to the reference space of the MNI single subject brain. The superposition of the cytoarchitectonic maps in the MNI brain shows the intersubject variability of the various Ch compartments and their stereotaxic position relative to other brain structures. Both the right and left Ch4 regions showed significantly smaller volumes when age was considered as a covariate. Probabilistic maps of compartments of the basal forebrain magnocellular system are now available as an open source reference for correlation with fMRI, PET, and structural MRI data of the living human brain.
Figures
Figure 1
Low magnification series of coronal sections from rostral (A) to caudal (F) from a male subject (#1696) stained with the Merker (1983) method to show the location of magnocellular basal forebrain cell groups in relation to other brain structures. The various Ch cell groups as delineated on the images of the sections are color-coded: Ch1-2: red; Ch3: green; Ch4: blue and Ch4p: beige. Ch4p group is marked by two lines in panel (F). Delineated areas are blown up in subsequent figures. Numbered letters under each panel refer to the corresponding figure. ACb, nucleus accumbens; ac, anterior commissure; Cd, caudate nucleus; Cl, claustrum; EGP, external globus pallidus; IGP, internal globus pallidus; ic, internal capsule; ox, optic chiasm; Pu, putamen. Bar scale: 5 mm.
Figure 2
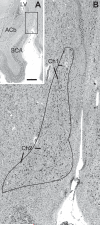
Septum-diagonal band complex (Ch1-2 groups). A: Low magnification to show the septal region. Box outlines the approximate area enlarged in (B). B: High magnification from panel (A) to demonstrate the cytoarchitecture of the Ch1-2 groups. The delineated area from the high-resolution image of the section roughly corresponds to the original traced region shown with red in the box of Fig. 1A. Note that in the dorsal part of this area the cells are smaller and oriented vertically (Ch1), while in more ventral parts, the neurons are larger without apparent orientation (Ch2). ACb, nucleus accumbens; LV, lateral ventricle; SCA, subcallosal area. Bar scale in (A): 2mm for (A), 240 μm for (B).
Figure 3
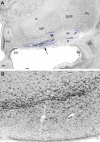
A: The Ch3 cell group (boxed area) and the lamellar-like protrusions of the Ch4 groups underneath of the nucleus accumbens. The large aggregate of darkly stained cell group within the ventrolateral corner of the bed nucleus of the stria terminalis (BSt) was also classified as Ch4. Panel (A) depicts the same section as shown in Fig. 1B at higher magnification. The original green tracing used for the Ch3 group in the boxed area in (A) is reinforced with black line. This level is characterized by the crossing fibers of the anterior commissure (ac). The ventral border of the ventral pallidum (VP), that can be recognized with the naked eye as a shiny tissue area to its high iron content, is marked with white asterisks. Panel (B) is a high resolution image from the boxed area in panel (A). Magnocellular neurons of the Ch3 group are loosely arranged between the fibers of the diagonal band showing a variety of orientations. Pir, piriform cortex; f, fornix. Bar scale in (A): 1 mm for (A), 175 μm for (B).
Figure 4
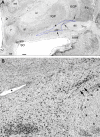
Coronal section at the level of the anterior hypothalamic area with the Ch 4 cell groups in the sublenticular tissue. The supraoptic (SO) and the neurosecretory cells of the paraventricular hypothalamic nucleus (PV) along the third ventricle are stand out with their large, darkly stained neurons. Large delineated area in the sublenticular gray with several smaller cell groups belonging to the Ch4 cell groups around the posterior limb of the anterior commissure are visible (single arrows). A small Ch4 cell group along the ventral border of the globus pallidus is labeled by double arrow. A: The same section as Fig. 1C with the original tracing. B: Area from panel (A), large arrows at the bottom of the section in (A) indicate the approximate field enlarged in (B). Note the magnocellular cells are oriented parallel with the ventral surface of the brain. EGP, external pallidal segment; f, fornix; IGP, internal pallidal segment; ic, internal capsule, ox, optic chiasm; Pir, piriform cortex; Pu, putamen; VCI, ventral claustrum. Bar scale in (A) 1 mm for (A), 115 μm for (B).
Figure 5
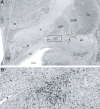
Coronal section, approximately 3.6 mm caudal to Fig. 4. Delineated area belongs to the Ch4 compartment in the sublenticular gray. A: The same section as Fig. 1C with the original tracing. Arrows point to a large (medially) and two smaller cell clusters. B: An enlargement from panel (A) to show the cytoarchitecture of the Ch4 group at this level. Double arrows point to the small cell cluster near the medial aspect of the temporal limb of the anterior commissure (labeled by asterisks). The large cell cluster from (A) is located in the lower left corner of this panel Note the loose arrangement of large cells between these two cell clusters and the fact that the number of large, darkly stained cells rapidly diminish dorsally towards the globus pallidus, allowing a clear demarcation of the Ch4 cell groups from the rest of the brain. al, ansa lenticularis. Asterisk in (A) and (B) mark the same vessel as fiducial marker. Scale bar: in (A) 1 mm for (A) and 100 μm for (B).
Figure 6
Coronal section at the caudal level of the supraoptic hypothalamic nucleus (SO). Note several delineated cell groups of the Ch4 compartment underneath the inner (IGP) and external segments (EGP) of the globus pallidus. One small cell cluster is embedded in the medial aspect of IGP, near the fibers of the internal capsule (between arrows). Same section as Fig. 1E with the original tracing. The ansa peduncularis (ap) passes through the Ch4 cell groups. Inside of the large delineated island of the Ch4 cell group that is attached to the medial aspect of the anterior commissure an arrow points to a cell cluster. f, fornix; mt, mammillothalamic tract; ot, optic tract. Scale bar: 1 mm.
Figure 7
Coronal section through the posterior portion of the Ch4 complex (Ch4p) at the level of the ventromedial hypothalamic (VM) nucleus. The same section as Fig. 1F. The boxed area with a large cell cluster is enlarged in panel (B). Since Ch4p was traced originally with beige color that is poorly visible, another large cell aggregate is marked with an arrow. A small cell cluster attached to the dorsomedial surface of the anterior commissure is labeled by a solid line in (A). Asterisk marks the same vessel in (A) and (B) for orientation. ot, optic tract; I, intercalated cell nucleus of the amygdala. Scale bar: in (A) 1 mm for (A) and 75 μm for (B).
Figure 8
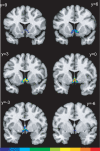
Probabilistic maps of the Ch1-2 cell groups in the anatomical MNI space. The y coordinates indicate distances from the anterior commissure in mm in the rostro-caudal directions. The left hemisphere is left in the image. The frequency with which the actual anatomical structure is overlapped in the sample of ten brains is color coded. The scale at the bottom of this figure indicates the degree of overlap in each voxel. The blue areas show that only one brain is represented with its actual structure, red color shows that all ten brains are overlapping. Voxels representing ten brains are located between levels y=3 and y=0.
Figure 9
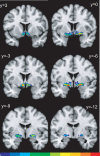
Probabilistic maps of the Ch3 cell groups at four rostro-caudal levels. The scale at right of this figure indicates the degree of overlap in each voxel. Same color code as in Fig. 8. Note that voxel representing maximum overlap are located between levels y=0 and y=-3.
Figure 10
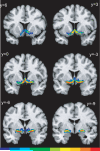
Probabilistic maps of the Ch4 cell groups at six rostro-caudal levels. Color code is the same as in Figs. 8-9. Note that most of the voxels representing maximum overlap (ten brains) are located at level y=-6.
Figure 11
Probabilistic maps of the Ch4p cell groups at four rostro-caudal levels. Note the paucity of red voxels, indicating that most of the voxels originate from individual brains.
Figure 12
Probabilistic maps showing all Ch groups without divisions into different compartments. Note that these maps show many more red voxels than previous maps of individual compartments due to the fact that the individual Ch compartments overlap at their borders. Same color code as Figs. 8-11.
Figure 13
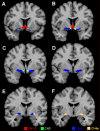
Maximum probability maps (MPMs) of all Ch groups in the anatomical MNI space (A, rostral; F, caudal). In the MPM each voxel is assigned to the cytoarchitectonic compartment that showed the greatest overlap among the ten examined brains. Note the colors represent individual Ch compartments, similarly as in Figure 1, and not the degree of overlap as in Figures 8-12. Red: Ch1-2 cell groups; green: Ch3; blue: Ch4; beige: Ch4p. In this figure the left hemisphere is right.
Figure 14
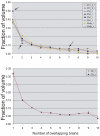
Frequency distribution of the various Ch4 cell groups showing the relation of overlapping volumes in the anatomical MNI space. In order to make the distributions of the various Ch compartments with different volumes comparable for all nuclei, we normalized the histograms by the sum of voxels (for original data see Supplementary Table 1.). Upper histogram displays the individual Ch compartments, lower histogram show the total left and right Ch space only. For example, the total volume of right Ch3 compartment is represented in the MNI space by 856 mm3, from this volume 424 voxels (424mm3) originates from single brains, thus occupying 49.5% of the total space dedicated to Ch3; 105 voxels originate from 2 brains (12.3%) and 51 voxels from seven brains (5.9%). For easier orientation, these percentage values are marked by arrows in the upper diagram. The lower diagram shows only the distribution of voxels from the total left and right Ch compartments, respectively. For example, the total volume of the right Ch space in the MNI reference brain is represented by 4855 voxels (4855 mm3), from this volume 166 mm3 represent overlapping space from 10 brains, while 1549 mm3 devoted to Ch space originating from single brains (for more details see Supplementary Table 1).
Figure 15
Plots showing the correlation between age and volume of the Ch4 left and Ch4 right groups**.** Both the left and right Ch4 compartments showed a negative correlation with age (α=0.05) using ANOVA with a repeated measures design.
Figure 16
Computer-assisted (AmiraR) 3D reconstruction of the Ch1-4 cell groups of the right hemisphere of the same case shown in the histological sections of Figs. 1-7 (case #1696). The various Ch compartments are color-coded. A and B: coronal view with two different angles inclined towards the viewer. C: lateral view, D: aspect from below. The Ch4 (blue) compartment consists of various size and shaped bands or clusters that are in part parallel and in part are associated each other. For better orientation, some of the larger clusters are arbitrarily termed with letters a-e. Note that clusters b and c of the Ch4 compartment are attached to each other in panels (B) and (D) but are separated in (A) and (C), however, compartments c and d are in all aspects grown together. The Ch1-2 (red) and the Ch3 (green) compartments show simpler 3D configurations. The posterior Ch4 compartments (yellow) consist of several smaller clusters that are partially covered by the Ch4 cell groups (primarily by cluster e) in panels (A-C) but are clearly visible from a ventral aspect (D).
Similar articles
- Cytoarchitectonic mapping of the human amygdala, hippocampal region and entorhinal cortex: intersubject variability and probability maps.
Amunts K, Kedo O, Kindler M, Pieperhoff P, Mohlberg H, Shah NJ, Habel U, Schneider F, Zilles K. Amunts K, et al. Anat Embryol (Berl). 2005 Dec;210(5-6):343-52. doi: 10.1007/s00429-005-0025-5. Anat Embryol (Berl). 2005. PMID: 16208455 - 192IgG-saporin immunotoxin-induced loss of cholinergic cells differentially activates microglia in rat basal forebrain nuclei.
Rossner S, Härtig W, Schliebs R, Brückner G, Brauer K, Perez-Polo JR, Wiley RG, Bigl V. Rossner S, et al. J Neurosci Res. 1995 Jun 15;41(3):335-46. doi: 10.1002/jnr.490410306. J Neurosci Res. 1995. PMID: 7563226 - GABAergic and cholinergic basal forebrain and preoptic-anterior hypothalamic projections to the mediodorsal nucleus of the thalamus in the cat.
Gritti I, Mariotti M, Mancia M. Gritti I, et al. Neuroscience. 1998 Jul;85(1):149-78. doi: 10.1016/s0306-4522(97)00573-3. Neuroscience. 1998. PMID: 9607710 - The basal forebrain corticopetal system revisited.
Zaborszky L, Pang K, Somogyi J, Nadasdy Z, Kallo I. Zaborszky L, et al. Ann N Y Acad Sci. 1999 Jun 29;877:339-67. doi: 10.1111/j.1749-6632.1999.tb09276.x. Ann N Y Acad Sci. 1999. PMID: 10415658 Review.
Cited by
- Distinct alterations of functional connectivity of the basal forebrain subregions in insomnia disorder.
Jiang G, Feng Y, Li M, Wen H, Wang T, Shen Y, Chen Z, Li S. Jiang G, et al. Front Psychiatry. 2022 Oct 13;13:1036997. doi: 10.3389/fpsyt.2022.1036997. eCollection 2022. Front Psychiatry. 2022. PMID: 36311494 Free PMC article. - Potential of Heterogeneous Compounds as Antidepressants: A Narrative Review.
Hu G, Zhang M, Wang Y, Yu M, Zhou Y. Hu G, et al. Int J Mol Sci. 2022 Nov 9;23(22):13776. doi: 10.3390/ijms232213776. Int J Mol Sci. 2022. PMID: 36430254 Free PMC article. Review. - From Synaptic Physiology to Synaptic Pathology: The Enigma of α-Synuclein.
Nordengen K, Morland C. Nordengen K, et al. Int J Mol Sci. 2024 Jan 12;25(2):986. doi: 10.3390/ijms25020986. Int J Mol Sci. 2024. PMID: 38256059 Free PMC article. Review. - Atrophy of the cholinergic regions advances from early to late mild cognitive impairment.
Lai YL, Hsu FT, Yeh SY, Kuo YT, Lin HH, Lin YC, Kuo LW, Chen CY, Liu HS; Alzheimer’s Disease Neuroimaging Initiative. Lai YL, et al. Neuroradiology. 2024 Apr;66(4):543-556. doi: 10.1007/s00234-024-03290-6. Epub 2024 Jan 19. Neuroradiology. 2024. PMID: 38240769 - Basal forebrain atrophy correlates with amyloid β burden in Alzheimer's disease.
Kerbler GM, Fripp J, Rowe CC, Villemagne VL, Salvado O, Rose S, Coulson EJ; Alzheimer's Disease Neuroimaging Initiative. Kerbler GM, et al. Neuroimage Clin. 2014 Nov 27;7:105-13. doi: 10.1016/j.nicl.2014.11.015. eCollection 2015. Neuroimage Clin. 2014. PMID: 25610772 Free PMC article.
References
- Amunts K, Schleicher A, Burgel U, Mohlberg H, Uylings HBM, Zilles K. Broca’s region revisited: Cytoarchitecture and intersubject variability. J. Comp. Neurol. 1999;412:319–341. - PubMed
- Amunts K, Schleicher A, Zilles K. Conceptual Advances Brain Res. Taylor and Francis, Inc.; New York, NY: 2002. Architectonic mapping of the human cerebral cortex; pp. 29–52.
- Amunts K, Weiss PH, Mohlberg H, Pieperhoff P, Eickhoff S, Gurd JM, Marshall JC, Shah NJ, Fink GR, Zilles K. Analysis of neural mechanisms underlying verbal fluency in cytoarchitectonically defined stereotaxic space - the roles of Brodmann areas 44 and 45. NeuroImage. 2004;22:42–56. - PubMed
- Amunts K, Kedo O, Kindler M, Pieperhoff H, Mohlberg H, Shah NJ, Habel U, Schneider F, Zilles K. Cytoarchiteconic mapping of the human amygdala, hippocampal region and entorhinal cortex: intersubject variability and probability maps. Anat. Embryol. 2005;210:343–352. - PubMed
Publication types
MeSH terms
Grants and funding
- R01 NS023945-17S1/NS/NINDS NIH HHS/United States
- R01 NS023945-17/NS/NINDS NIH HHS/United States
- NS023945/NS/NINDS NIH HHS/United States
- R01 NS023945/NS/NINDS NIH HHS/United States
- RF1 NS023945/NS/NINDS NIH HHS/United States
LinkOut - more resources
Full Text Sources

