A3 adenosine receptor signaling influences pulmonary inflammation and fibrosis - PubMed (original) (raw)
A3 adenosine receptor signaling influences pulmonary inflammation and fibrosis
Eva Morschl et al. Am J Respir Cell Mol Biol. 2008 Dec.
Abstract
Adenosine is a signaling molecule produced during conditions that cause cellular stress or damage. This signaling pathway is implicated in the regulation of pulmonary disorders through the selective engagement of adenosine receptors. The goal of this study was to examine the involvement of the A(3) adenosine receptor (A(3)R) in a bleomycin model of pulmonary inflammation and fibrosis. Results demonstrated that A(3)R-deficient mice exhibit enhanced pulmonary inflammation that included an increase in eosinophils. Accordingly, there was a selective up-regulation of eosinophil-related chemokines and cytokines in the lungs of A(3)R-deficient mice exposed to bleomycin. This increase in eosinophil numbers was accompanied by a decrease in the amount of extracellular eosinophil peroxidase activity in lavage fluid from A(3)R-deficient mice exposed to bleomycin, an observation suggesting that the A(3)R is necessary for eosinophil degranulation in this model. Despite an increase in inflammatory metrics associated with A(3)R-deficient mice treated with bleomycin, there was little difference in the degree of pulmonary fibrosis. Examination of fibrotic mediators demonstrated enhanced transforming growth factor (TGF)-beta1 expression, but not a concomitant increase in TGF-beta1 activity. This was associated with the loss of expression of matrix metalloprotease 9, an activator of TGF-beta1, in alveolar macrophages and airway mast cells in the lungs of A(3)R-deficient mice. Together, these results suggest that the A(3)R serves antiinflammatory functions in the bleomycin model, and is also involved in regulating the production of mediators that can impact fibrosis.
Figures
**Figure 1.
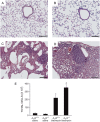
Pulmonary histopathology and inflammation. Mice were killed 14 days after saline or bleomycin exposure, and the lungs were lavaged and processed for hematoxylin and eosin staining. (A) Lung section from an A3R+/+ mouse exposed to saline. (B) Lung section from an A3R−/− mouse exposed to saline. (C) Lung section from an A3R+/+ mouse exposed to bleomycin. (D) Lung section from an A3R−/− mouse exposed to bleomycin. Photographs are representative of six to eight mice from each condition; scale bars = 100 μm. (E) Total bronchoalveolar lavage (BAL) cell counts presented as mean cell counts × 104 ± SEM. *Significant difference compared with saline treatment, #significant difference compared with bleomycin-treated A3R+/+ mice (P < 0.05, n = 6–8).
**Figure 2.
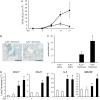
Pulmonary eosinophil recruitment. (A) BAL was collected on Days 1, 3, 7, 14, and 21 after bleomycin exposure, and cells were cytospun onto slides, stained with Diff-Quick, and eosinophils counted using a hemocytometer. Triangles depict eosinophils from A3R+/+ mice exposed to bleomycin, while squares depict eosinophils from A3R−/− mice exposed to bleomycin. Data are presented as mean cell counts × 104 ± SEM. *Significant difference compared with A3R+/+ mice (P < 0.05, n = 3–8). (B) Lung sections from A3R+/+ and A3R−/− mice 14 days after exposure to bleomycin were stained with mMBP-1 to mark eosinophils; scale bar = 100 μm. (C) The number of mMBP-1–positive cells per mm2 was quantified in lung sections using ImagePro software. Data are presented as mean eosinophils/mm2 ± SEM. (D) Total cellular RNA was isolated from the lungs of wild-type (A3R +) or A3R−/− (A3R −) mice 14 days after exposure to saline (open bars) or bleomycin (solid bars). Quantitative rtPCR was used to quantify the levels of key eosinophil related cytokines and chemokines. Values were normalized to 18S ribosomal RNA and are presented as mean normalized transcript levels (Δ−Ct) ± SEM. *Significant difference from saline-treated A3R+/+ mice, #significant difference from bleomycin-treated A3R+/+ mice (P < 0.05, n = 6–8).
**Figure 3.
Eosinophil activity. (A) Eosinophil peroxidase activity was measured in the BAL fluid of mice 14 days after exposure to saline or bleomycin. (B) Eosinophil peroxidase activity was measured in the BAL cell pellets from mice 14 days after exposure to saline or bleomycin. Eosinophil peroxidase activity is presented as mean optical density (OD) at 490 nm/ml ± SEM. *Significant difference from saline-treated A3R+/+ mice, #significant difference from bleomycin-treated A3R+/+ mice (P < 0.05, n = 6–8).
**Figure 4.
Pulmonary fibrosis in A3R+/+ and A3R−/− mice. (A) A3R+/+ and A3R−/− mice were killed 14 days after saline or bleomycin exposure, and the lungs were processed for Masson's trichrome staining. Photographs are representative of six to eight mice from each condition; scale bars = 100 μm. (B) Ashcroft scores were determined by examining multiple sections from lungs of mice from each condition. Data are presented as mean Ashcroft score ± SEM (n = 6–8 lungs per condition). (C) RNA was extracted from the lungs of mice 14 days after saline or bleomycin exposure, and α1 procollagen levels were quantified using quantitative rtPCR. Values were normalized to 18S ribosomal RNA and are presented as mean normalized transcript levels (Δ−Ct) ± SEM (n = 6–8). (D) Collagen protein levels were measured in whole lungs 14 days after saline or bleomycin exposure using the Sircol assay. Data are presented as mean μg collagen per lung ± SEM (n = 6–8). *Significant difference from saline-treated A3R+/+ mice (P < 0.05).
**Figure 5.
TGF-β1 expression and activity. Total cellular RNA was isolated from the lungs (A) or BAL cell pellets (B) of wild-type (A3R +) or A3R−/− (A3R −) mice 14 days after exposure to saline (open bars) or bleomycin (solid bars). Quantitative rtPCR was used to measure TGF-β1 transcript levels. Values were normalized to 18S ribosomal RNA and are presented as mean normalized transcript levels (Δ−Ct) ± SEM (n = 6–8). (C) Active TGF-β1 protein levels were determined in BAL fluid from mice treated the same as in A and B. Values are presented as mean pg/ml TGF-β1 ± SEM (n = 4–6). *Significant difference from saline-treated A3R+/+ mice, #significant difference from bleomycin-treated A3R+/+ mice (P < 0.05).
**Figure 6.
Matrix metalloproteinase (MMP)-9 and tissue inhibitor of metalloproteinase (TIMP)-1 expression and activity. (A) Total cellular RNA was isolated from the lungs of wild-type (A3R +) or A3R−/− (A3R −) mice 14 days after exposure to saline (open bars) or bleomycin (solid bars). Quantitative rtPCR was used to quantify the levels MMP-9 transcripts. Values were normalized to 18S ribosomal RNA and are presented as mean normalized transcript levels (Δ−Ct) ± SEM (n = 6–8). (B) BAL fluid (20 μl from saline-, and 10 and 5 μl from bleomycin-treated samples) were subjected to 10% SDS-PAGE in gels containing 0.02% gelatin. Gels were fixed and stained with 50% methanol and 10% acetic acid that contained 0.3% wt/vol Coomassie blue. MMP-9 and MMP-2 bands were identified by their molecular weight. MMP-9 (C) and TIMP-1 (D) activities were determined in BAL fluid using specific immunoassays. (E) MMP-9 and TIMP-1 BAL fluid activities were used to determine a ratio of MMP-9 to TIMP-1. Data are presented as means ± SEM. *Significant difference from saline-treated A3R+/+ mice, #significant difference from bleomycin-treated A3R+/+ mice (P < 0.05, n = 6–8).
**Figure 7.
MMP-9 immunolocalization. Mice were killed 14 days after saline or bleomycin exposure, and the lungs were lavaged and processed for MMP-9 immunolocalization. Immunoperoxidase detection using a MMP-9 antibody was used to localize MMP-9 (brown stain) to inflammatory cells in the lungs of (A) A3R+/+ mice exposed to bleomycin and (B) A3R−/− mice exposed to bleomycin. The same antibody was used in an immunofluorecence assay to examine MMP-9 expression (green) in BAL cells from (C) A3R+/+ mice exposed to bleomycin and (D) A3R−/− mice exposed to bleomycin. Blue staining denotes DAPI-stained nuclei. Mast cells were localized in bronchi of (E) A3R+/+ mice exposed to bleomycin and (G) A3R−/− mice exposed to bleomycin using tolidine blue staining. MMP-9 immunoperoxidase detection (brown stain) was used to localize MMP-9 to mast cells in the bronchi of (F) A3R+/+ mice exposed to bleomycin and (G) A3R−/− mice exposed to bleomycin. n, neutrophils; Φ, macrophages; arrows denote mast cells. Scale bars: A and B, 50 μm; C and D, 10 μm; H, 10 μm (also applies to E–G).
Similar articles
- Glycosyltransferases and glycosaminoglycans in bleomycin and transforming growth factor-β1-induced pulmonary fibrosis.
Venkatesan N, Tsuchiya K, Kolb M, Farkas L, Bourhim M, Ouzzine M, Ludwig MS. Venkatesan N, et al. Am J Respir Cell Mol Biol. 2014 Mar;50(3):583-94. doi: 10.1165/rcmb.2012-0226OC. Am J Respir Cell Mol Biol. 2014. PMID: 24127863 - [Effects of andrographolide on the concentration of cytokines in BALF and the expressions of type I and III collagen mRNA in lung tissue in bleomycin-induced rat pulmonary fibrosis].
Zhu HL, Huang CL, Wang WJ, Zhan XQ, Fan XM. Zhu HL, et al. Xi Bao Yu Fen Zi Mian Yi Xue Za Zhi. 2011 Jul;27(7):725-9. Xi Bao Yu Fen Zi Mian Yi Xue Za Zhi. 2011. PMID: 21722520 Chinese. - Thrombospondin-1-deficient mice are not protected from bleomycin-induced pulmonary fibrosis.
Ezzie ME, Piper MG, Montague C, Newland CA, Opalek JM, Baran C, Ali N, Brigstock D, Lawler J, Marsh CB. Ezzie ME, et al. Am J Respir Cell Mol Biol. 2011 Apr;44(4):556-61. doi: 10.1165/rcmb.2009-0019OC. Epub 2010 Jun 25. Am J Respir Cell Mol Biol. 2011. PMID: 20581099 Free PMC article. - Asiatic acid ameliorates pulmonary fibrosis induced by bleomycin (BLM) via suppressing pro-fibrotic and inflammatory signaling pathways.
Dong SH, Liu YW, Wei F, Tan HZ, Han ZD. Dong SH, et al. Biomed Pharmacother. 2017 May;89:1297-1309. doi: 10.1016/j.biopha.2017.03.005. Epub 2017 Mar 17. Biomed Pharmacother. 2017. PMID: 28320097 - Anlotinib attenuated bleomycin-induced pulmonary fibrosis via the TGF-β1 signalling pathway.
Ruan H, Lv Z, Liu S, Zhang L, Huang K, Gao S, Gan W, Liu X, Zhang S, Helian K, Li X, Zhou H, Yang C. Ruan H, et al. J Pharm Pharmacol. 2020 Jan;72(1):44-55. doi: 10.1111/jphp.13183. Epub 2019 Oct 28. J Pharm Pharmacol. 2020. PMID: 31659758
Cited by
- Truncated Nucleosides as A(3) Adenosine Receptor Ligands: Combined 2-Arylethynyl and Bicyclohexane Substitutions.
Tosh DK, Paoletta S, Phan K, Gao ZG, Jacobson KA. Tosh DK, et al. ACS Med Chem Lett. 2012 Jul 12;3(7):596-601. doi: 10.1021/ml300107e. Epub 2012 Jun 11. ACS Med Chem Lett. 2012. PMID: 23145215 Free PMC article. - Smoking-dependent reprogramming of alveolar macrophage polarization: implication for pathogenesis of chronic obstructive pulmonary disease.
Shaykhiev R, Krause A, Salit J, Strulovici-Barel Y, Harvey BG, O'Connor TP, Crystal RG. Shaykhiev R, et al. J Immunol. 2009 Aug 15;183(4):2867-83. doi: 10.4049/jimmunol.0900473. Epub 2009 Jul 27. J Immunol. 2009. PMID: 19635926 Free PMC article. - Emerging cellular and molecular determinants of idiopathic pulmonary fibrosis.
Phan THG, Paliogiannis P, Nasrallah GK, Giordo R, Eid AH, Fois AG, Zinellu A, Mangoni AA, Pintus G. Phan THG, et al. Cell Mol Life Sci. 2021 Mar;78(5):2031-2057. doi: 10.1007/s00018-020-03693-7. Epub 2020 Nov 17. Cell Mol Life Sci. 2021. PMID: 33201251 Free PMC article. Review. - Adenosine receptors as targets for therapeutic intervention in asthma and chronic obstructive pulmonary disease.
Polosa R, Blackburn MR. Polosa R, et al. Trends Pharmacol Sci. 2009 Oct;30(10):528-35. doi: 10.1016/j.tips.2009.07.005. Epub 2009 Sep 15. Trends Pharmacol Sci. 2009. PMID: 19762093 Free PMC article. Review. - Targeting the Immunomodulatory CD73/Adenosine System to Improve the Therapeutic Gain of Radiotherapy.
de Leve S, Wirsdörfer F, Jendrossek V. de Leve S, et al. Front Immunol. 2019 Apr 5;10:698. doi: 10.3389/fimmu.2019.00698. eCollection 2019. Front Immunol. 2019. PMID: 31024543 Free PMC article. Review.
References
- Thannickal VJ, Toews GB, White ES, Lynch JP III, Martinez FJ. Mechanisms of pulmonary fibrosis. Annu Rev Med 2004;55:395–417. - PubMed
- Panos RJ, Mortenson RL, Niccoli SA, King TE Jr. Clinical deterioration in patients with idiopathic pulmonary fibrosis: causes and assessment. Am J Med 1990;88:396–404. - PubMed
- Lynch J, Toews G. Idiopathic pulmonary fibrosis. In: Fishman AP, Elias JA, Fishman JA, Grippi MA, Kaiser LR, Senior RM, editors. Pulmonary diseases and disorders, 3rd ed. New York: McGraw-Hill; 1998. pp. 1069–1084.
- Sime PJ, O'Reilly KM. Fibrosis of the lung and other tissues: new concepts in pathogenesis and treatment. Clin Immunol 2001;99:308–319. - PubMed
Publication types
MeSH terms
Substances
LinkOut - more resources
Full Text Sources
Other Literature Sources
Medical
Molecular Biology Databases


