Robust, tunable biological oscillations from interlinked positive and negative feedback loops - PubMed (original) (raw)
Robust, tunable biological oscillations from interlinked positive and negative feedback loops
Tony Yu-Chen Tsai et al. Science. 2008.
Abstract
A simple negative feedback loop of interacting genes or proteins has the potential to generate sustained oscillations. However, many biological oscillators also have a positive feedback loop, raising the question of what advantages the extra loop imparts. Through computational studies, we show that it is generally difficult to adjust a negative feedback oscillator's frequency without compromising its amplitude, whereas with positive-plus-negative feedback, one can achieve a widely tunable frequency and near-constant amplitude. This tunability makes the latter design suitable for biological rhythms like heartbeats and cell cycles that need to provide a constant output over a range of frequencies. Positive-plus-negative oscillators also appear to be more robust and easier to evolve, rationalizing why they are found in contexts where an adjustable frequency is unimportant.
Figures
Fig. 1
Positive feedback provides an oscillator with a tunable frequency and nearly constant amplitude. (A) Schematic view of the Xenopus embryonic cell cycle. (B) Amplitude/frequency curves for various strengths of positive feedback (r). The frequency of the oscillator was changed by varying the rate constant for cyclin B synthesis, _k_synth. (C) Frequency as a function of _k_synth for various strengths of positive feedback.
Fig. 2
From a hysteretic switch to a relaxation oscillator. (A) Hysteretic steady-state response of CDK1 to cyclin B, on the basis of previous experimental studies (16, 17). (B) CDK1 activation and inactivation in the limit of slow cyclin B synthesis and degradation. (C and D) Cell cycle model run with biologically realistic parameters, showing a looser relation between the oscillations and the hysteretic steady-state response.
Fig. 3
Amplitude/frequency curves for various legacy oscillators. (A) Negative feedback–only models. (B) Positive-plus-negative feedback models.
Fig. 4
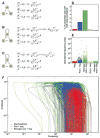
Randomly parameterized oscillator models. (A) Negative feedback–only. A, B, and C, the fractions of proteins A, B, and C that are active; K, median effective concentration values of the Hill functions; n, Hill coefficients; k, rate constants. (B) Positive-plus-negative feedback. (C) Negative-plus-negative feedback. (D) Percentage of parameter sets that yielded limit cycle oscillations. For the positive-plus-negative and negative-plus-negative models, we looked at two ranges of feedback strengths: (i) _k_7 = 0 to 100 (weak) and (ii) _k_7 = 500 to 600 (strong). (E) Operational frequency ranges for the oscillators. Each point represents _freq_max/_freq_min for one of the 2500 parameter sets that produced oscillations, with _k_3 as the bifurcation parameter. Mean operational frequency ranges were 1.6, 370, 63, 1.6, and 1.6. Medians were 1.6, 2.2, 3.3, 1.6, and 1.6. (F) Amplitude/frequency curves for the randomly parameterized models. We show 300 out of 500 curves for the negative feedback–only model (red) and the positive-plus-negative feedback model with weak (blue) or strong (green) positive feedback. Curves for the negative-plus-negative feedback model are shown in fig. S1.
References
- Thron CD. Biophys Chem. 1996;57:239. - PubMed
- Goldbeter A, et al. Chaos. 2001;11:247. - PubMed
- Tyson JJ, Chen KC, Novak B. Curr Opin Cell Biol. 2003;15:221. - PubMed
- Smolen P, Baxter DA, Byrne JH. Am J Physiol. 1998;274:C531. - PubMed
- Goldbeter A. Nature. 2002;420:238. - PubMed
Publication types
MeSH terms
Substances
LinkOut - more resources
Full Text Sources
Other Literature Sources


