Maternal depletion of CTCF reveals multiple functions during oocyte and preimplantation embryo development - PubMed (original) (raw)
Maternal depletion of CTCF reveals multiple functions during oocyte and preimplantation embryo development
Le-Ben Wan et al. Development. 2008 Aug.
Abstract
CTCF is a multifunctional nuclear factor involved in epigenetic regulation. Despite recent advances that include the systematic discovery of CTCF-binding sites throughout the mammalian genome, the in vivo roles of CTCF in adult tissues and during embryonic development are largely unknown. Using transgenic RNAi, we depleted maternal stores of CTCF from growing mouse oocytes, and identified hundreds of misregulated genes. Moreover, our analysis suggests that CTCF predominantly activates or derepresses transcription in oocytes. CTCF depletion causes meiotic defects in the egg, and mitotic defects in the embryo that are accompanied by defects in zygotic gene expression, and culminate in apoptosis. Maternal pronuclear transfer and CTCF mRNA microinjection experiments indicate that CTCF is a mammalian maternal effect gene, and that persistent transcriptional defects rather than persistent chromosomal defects perturb early embryonic development. This is the first study detailing a global and essential role for CTCF in mouse oocytes and preimplantation embryos.
Figures
Fig. 1. CTCF depletion in oocytes and embryos
(A) Quantification of nuclear CTCF immunofluorescence staining in growing oocytes. Ntg and Tg indicate oocytes derived from 10-day-old Ntg and Tg littermates, respectively. Lines 1, 12 and 21 are shown. *P<0.0001; _n_=number of oocytes. (B) Immunofluorescence images of CTCF-stained oocytes and embryos. One confocal section of an egg or embryo is shown per panel, with red indicating CTCF-stained nuclei. Line 1 is shown. Scale bar: 40 μm. (C) Schematic of CTCF depletion in oocytes and embryos. Ntg females were mated to Tg males and ∼50% of female progeny inherited the transgene. All oocytes from Tg females were CTCF depleted. CTCF-replete oocytes and embryos are depicted in brown, whereas CTCF-depleted oocytes and embryos are depicted in white. Pink and blue circles represent maternal and paternal pronuclei, respectively. GV, germinal vesicle; hr, hours post-hCG.
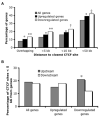
Fig. 2. Transcriptional misregulation in CTCF-depleted oocytes
(A) Percentages of genes within 0 (overlapping), 5, 10 and 50 kb of a CTCF-binding site. The proportions of nearby upregulated and especially downregulated genes were significantly higher than background (all genes) within every distance threshold. *P<0.05; **P<10−8, †P<10−7, ‡P<10−5.(B) Percentages of CTCF binding sites within 5 kb of all, upregulated and downregulated genes. Among sites within 5 kb of downregulated genes, the percentage of upstream sites was significantly higher than the percentage of downstream sites, compared with background. *P<0.05.
Fig. 3. Meiotic defects in CTCF-depleted oocytes
Eggs having undergone GVBD by 2 hours of culture were processed for diakinesis spreads. Eggs that have undergone PBE by 16 hours of culture were processed for M2 spreads. Line 1 is shown. Seven percent (3/42) of Tg eggs that have undergone PBE contained roughly 20 bivalents. _n_=number of oocytes. Scale bar: 0.1 μm.
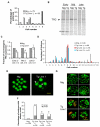
Fig. 4. Early mitotic defects leading to apoptosis
(A) Embryo development in culture. One-cell embryos were cultured to 72 hours post-hCG and categorized according to cell number. Line 1 is shown. _n_=number of embryos. (B) Autoradiogram and (C) quantification of TRC upregulation. Two-cell embryos from Line 1 were radiolabeled at various timepoints post-cleavage. At each timepoint, TRC expression in 3-5 embryos derived from Tg mice were normalized to TRC expression in an equivalent number of embryos derived from Ntg mice (relative expression=1). Early, Mid and Late indicate embryos radiolabeled at 6, 12 and 21 hours post-cleavage; *P<0.05; _n_=number of experiments. + indicates Spindlin, an abundant maternal protein. (D) Embryo development in vivo. Cleavage-stage embryos were flushed at 72 hours post-hCG and categorized according to cell number. Lines 1, 12 and 21 are shown. _n_=number of embryos. (E) Immunofluorescence images of DAPI-stained embryos in D. One confocal section of an embryo is shown per panel, with green indicating DAPI-stained nuclei. Line 1 is shown. Tg embryos have ectopic nuclei. Arrow, large ectopic nucleus; arrowhead, small ectopic nucleus. Scale bar: 20 μm. (F) Percentages of embryos in D with ectopic nuclei. Embryos were categorized according to whether large (white bars) or small (gray bars) ectopic nuclei were observed. Lines 1, 12 and 21 are shown. *P<0.05; **P<0.0001; _n_=number of embryos. (G) Apoptosis at 120 hours post-hCG. One-cell embryos were cultured to 120 hours post-hCG and TUNEL stained. One embryo is shown per panel, with green indicating DAPI-stained nuclei and red indicating TUNEL staining. Line 1 is shown. Only 7% (2/28) of embryos derived from Tg mice versus 94% (29/31) of embryos derived from Ntg littermates formed a blastoceol cavity by 120 hours post-hCG. Scale bar: 40 μm.
Fig. 5. Maternal pronuclear transfer and Ctcf mRNA-injection experiments
(A) Maternal pronuclear transfer experiments. Maternal pronuclei (mPNs) were reconstructed with one-cell embryos and cultured until 72 hours post-hCG. The average cell number per transfer-type at 72 hours post-hCG is indicated. Ntg and Tg (Line 1) indicate mPNs or embryos derived from Ntg and Tg littermates, respectively. Bars labeled A are significantly different from bars labeled B (overall P<0.0001). _n_=number of embryos. (B) Immunofluorescence images of CTCF-stained embryos after cytoplasmic mRNA microinjection. One-cell embryos from Line 1 were microinjected with CTCF or control GFP mRNA, and cultured until 72 hours post-hCG. One confocal section of an embryo is shown per panel, with red indicating CTCF-stained nuclei. Scale bar: 40 μm. (C) Embryo development after cytoplasmic mRNA microinjection. The average cell number per microinjection-type at 72 hours post-hCG is indicated. Bars labeled A are significantly different from bars labeled B (overall P<0.0001). _n_=number of embryos.
Similar articles
- Transgenic RNAi reveals essential function for CTCF in H19 gene imprinting.
Fedoriw AM, Stein P, Svoboda P, Schultz RM, Bartolomei MS. Fedoriw AM, et al. Science. 2004 Jan 9;303(5655):238-40. doi: 10.1126/science.1090934. Science. 2004. PMID: 14716017 - Pax6 regulation in retinal cells by CCCTC binding factor.
Li T, Lu Z, Lu L. Li T, et al. Invest Ophthalmol Vis Sci. 2006 Dec;47(12):5218-26. doi: 10.1167/iovs.06-0254. Invest Ophthalmol Vis Sci. 2006. PMID: 17122106 Free PMC article. - Loss of maternal CTCF is associated with peri-implantation lethality of Ctcf null embryos.
Moore JM, Rabaia NA, Smith LE, Fagerlie S, Gurley K, Loukinov D, Disteche CM, Collins SJ, Kemp CJ, Lobanenkov VV, Filippova GN. Moore JM, et al. PLoS One. 2012;7(4):e34915. doi: 10.1371/journal.pone.0034915. Epub 2012 Apr 20. PLoS One. 2012. PMID: 22532833 Free PMC article. - The role of CCCTC-binding factor (CTCF) in genomic imprinting, development, and reproduction.
Franco MM, Prickett AR, Oakey RJ. Franco MM, et al. Biol Reprod. 2014 Nov;91(5):125. doi: 10.1095/biolreprod.114.122945. Epub 2014 Oct 8. Biol Reprod. 2014. PMID: 25297545 Review. - Genetics and epigenetics of the multifunctional protein CTCF.
Filippova GN. Filippova GN. Curr Top Dev Biol. 2008;80:337-60. doi: 10.1016/S0070-2153(07)80009-3. Curr Top Dev Biol. 2008. PMID: 17950379 Review.
Cited by
- Absence of MSY2 in mouse oocytes perturbs oocyte growth and maturation, RNA stability, and the transcriptome.
Medvedev S, Pan H, Schultz RM. Medvedev S, et al. Biol Reprod. 2011 Sep;85(3):575-83. doi: 10.1095/biolreprod.111.091710. Epub 2011 May 25. Biol Reprod. 2011. PMID: 21613634 Free PMC article. - Regulation of oocyte and cumulus cell interactions by intermedin/adrenomedullin 2.
Chang CL, Wang HS, Soong YK, Huang SY, Pai SY, Hsu SY. Chang CL, et al. J Biol Chem. 2011 Dec 16;286(50):43193-203. doi: 10.1074/jbc.M111.297358. Epub 2011 Oct 18. J Biol Chem. 2011. PMID: 22009752 Free PMC article. - Remote Memory and Cortical Synaptic Plasticity Require Neuronal CCCTC-Binding Factor (CTCF).
Kim S, Yu NK, Shim KW, Kim JI, Kim H, Han DH, Choi JE, Lee SW, Choi DI, Kim MW, Lee DS, Lee K, Galjart N, Lee YS, Lee JH, Kaang BK. Kim S, et al. J Neurosci. 2018 May 30;38(22):5042-5052. doi: 10.1523/JNEUROSCI.2738-17.2018. Epub 2018 Apr 30. J Neurosci. 2018. PMID: 29712785 Free PMC article. - Dosage effects of cohesin regulatory factor PDS5 on mammalian development: implications for cohesinopathies.
Zhang B, Chang J, Fu M, Huang J, Kashyap R, Salavaggione E, Jain S, Kulkarni S, Deardorff MA, Uzielli ML, Dorsett D, Beebe DC, Jay PY, Heuckeroth RO, Krantz I, Milbrandt J. Zhang B, et al. PLoS One. 2009;4(5):e5232. doi: 10.1371/journal.pone.0005232. Epub 2009 May 1. PLoS One. 2009. PMID: 19412548 Free PMC article. - Functional and molecular characterization of the role of CTCF in human embryonic stem cell biology.
Balakrishnan SK, Witcher M, Berggren TW, Emerson BM. Balakrishnan SK, et al. PLoS One. 2012;7(8):e42424. doi: 10.1371/journal.pone.0042424. Epub 2012 Aug 3. PLoS One. 2012. PMID: 22879976 Free PMC article.
References
- Barski A, Cuddapah S, Cui K, Roh TY, Schones DE, Wang Z, Wei G, Chepelev I, Zhao K. High-resolution profiling of histone methylations in the human genome. Cell. 2007;129:823–837. - PubMed
- Bell AC, Felsenfeld G. Methylation of a CTCF-dependent boundary controls imprinted expression of the Igf2 gene. Nature. 2000;405:482–485. - PubMed
- Bell AC, West AG, Felsenfeld G. The protein CTCF is required for the enhancer blocking activity of vertebrate insulators. Cell. 1999;98:387–396. - PubMed
Publication types
MeSH terms
Substances
Grants and funding
- S06 GM008216/GM/NIGMS NIH HHS/United States
- GM078203/GM/NIGMS NIH HHS/United States
- R01 HD042026/HD/NICHD NIH HHS/United States
- R21 GM078203/GM/NIGMS NIH HHS/United States
- RR018907/RR/NCRR NIH HHS/United States
- GM08216/GM/NIGMS NIH HHS/United States
- R01 RR018907/RR/NCRR NIH HHS/United States
- HD42026/HD/NICHD NIH HHS/United States
LinkOut - more resources
Full Text Sources
Other Literature Sources
Molecular Biology Databases


