A FLEX switch targets Channelrhodopsin-2 to multiple cell types for imaging and long-range circuit mapping - PubMed (original) (raw)
A FLEX switch targets Channelrhodopsin-2 to multiple cell types for imaging and long-range circuit mapping
Deniz Atasoy et al. J Neurosci. 2008.
No abstract available
Figures
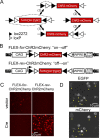
Figure 1.
Design and characterization of a FLEX switch for ChR2mCherry. A, FLEX switch recombination sequence for stable inversion proceeds in two steps: (1) inversion followed by (2) excision. loxP and lox2272 are orthogonal recombination sites. B, Construct design for FLEX-_for_-ChR2mCherry and FLEX-_rev_-ChR2mCherry. CAG, CMV enhancer/β-globin chimeric promoter; WPRE, woodchuck hepatitis virus posttranscriptional regulatory element; ITR, inverted terminal repeat. C, Images showing mCherry fluorescence in HEK 293 cells for FLEX-_for_-ChR2mCherry and FLEX-_rev_-ChR2mCherry in the presence and absence of Cre. D, Colocalization of EGFP and mCherry fluorescence (yellow arrowheads) in HEK 293 cells cotransfected with FLEX-_rev_-ChR2mCherry and Cre-_IRES_-EGFP.
Figure 2.
Cre-dependent ChR2mCherry expression in transgenic mice using rAAV-FLEX-_rev_-ChR2mCherry. A, Distribution of fluorescent neurons resulting from a large coinjection (150 nl) of rAAV-ChR2-EGFP and rAAV-FLEX-_rev_-ChR2mCherry into the hypothalamus of wild-type mice. Extensive fluorescence from EGFP (left) but no fluorescence from mCherry in brain slices (right) shows the absence of background expression with rAAV-FLEX-_rev_-ChR2mCherry. The background image of the slice was obtained from 4′,6′-diamidino-2-phenylindole fluorescence. B, Top, Schematic showing location of the imaged area in caudal arcuate nucleus. Bottom, mCherry fluorescence only in the arcuate nucleus after a large injection of rAAV-FLEX-_rev_-ChR2mCherry into the hypothalamus of pomc-cre;rosa26-loxSTOPlox-eyfp mice. Compare distribution of fluorescence with A. C, Colocalization of mCherry and EYFP fluorescence in arcuate nucleus. D, E, Similar to B and C; in this case, agrp-cre;rosa26-loxSTOPlox-eyfp mice were used with rAAV-FLEX-_rev_-ChR2mCherry virus injections. F, Top, Image showing neuron morphology from the arcuate nucleus of labeled POMC neurons. Bottom, Higher-magnification image of boxed area. G, H, Axonal projections of AGRP neurons infected with rAAV-FLEX-_rev_-ChR2mCherry. Strong axonal labeling was observed in the paraventricular nucleus of the hypothalamus (G) and paraventricular thalamus (H). 3V, Third ventricle; D3V, dorsal third ventricle.
Figure 3.
Photostimulation of AGRP and POMC neurons in the hypothalamus. A, B, Whole-cell voltage-clamp recordings from mCherry positive neurons in hypothalamic slices from agrp-cre or pomc-cre mice infected with rAAV-FLEX-_rev_-ChR2mCherry. Light pulses (500 ms) of varying power elicited ChR2mCherry-mediated inward currents. C, D, The peak current is plotted as a function of laser power for AGRP (C) and POMC (D) neurons. E, F, Perisomatic repetitive stimulation with 1 ms light pulses at 10 Hz in AGRP (E) and POMC (F) neurons. Blue dashes mark timing of light flashes.
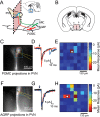
Figure 4.
Channelrhodopsin-assisted circuit mapping for hypothalamic neuronal circuits: AGRP→PVN and POMC→PVN. A, Diagram of a sagittal hypothalamic section depicting anatomy of connections between ARC and PVN. The pink box denotes the plane of the coronal slice. B, Coronal slices containing PVN, but not arcuate nucleus, were used for whole-cell voltage-clamp recordings from PVN neurons. C, Fluorescence image showing POMC axonal projections to PVN. Blue box outlines region of laser stimulation in E, PVN boundary is outlined in red, location of recorded cell body is marked by a star, and recording pipette is outlined in yellow. D, Overlay of POMC→PVN IPSCs resulting from three photostimulation trials at a site perisomatic to a voltage-clamped PVN neuron. E, Synaptic input map shows mean current responses over 100 ms time window as a color map in voltage-clamped PVN neuron resulting from LSPS of axons originating from POMC neurons. The position of the soma is marked with a star. F–H, Similar to C–E, but in this case, projections arise from AGRP neurons.
Similar articles
- Channelrhodopsin-2-assisted circuit mapping of long-range callosal projections.
Petreanu L, Huber D, Sobczyk A, Svoboda K. Petreanu L, et al. Nat Neurosci. 2007 May;10(5):663-8. doi: 10.1038/nn1891. Epub 2007 Apr 15. Nat Neurosci. 2007. PMID: 17435752 - Dual-level afferent control of growth hormone-releasing hormone (GHRH) neurons in GHRH-green fluorescent protein transgenic mice.
Baccam N, Alonso G, Costecalde T, Fontanaud P, Molino F, Robinson IC, Mollard P, Méry PF. Baccam N, et al. J Neurosci. 2007 Feb 14;27(7):1631-41. doi: 10.1523/JNEUROSCI.2693-06.2007. J Neurosci. 2007. PMID: 17301171 Free PMC article. - Selective suppression of plasticity in amygdala inputs from temporal association cortex by the external capsule.
Morozov A, Sukato D, Ito W. Morozov A, et al. J Neurosci. 2011 Jan 5;31(1):339-45. doi: 10.1523/JNEUROSCI.5537-10.2011. J Neurosci. 2011. PMID: 21209220 Free PMC article. - Direct excitation of hypocretin/orexin cells by extracellular ATP at P2X receptors.
Wollmann G, Acuna-Goycolea C, van den Pol AN. Wollmann G, et al. J Neurophysiol. 2005 Sep;94(3):2195-206. doi: 10.1152/jn.00035.2005. Epub 2005 Jun 15. J Neurophysiol. 2005. PMID: 15958604 - Dopamine inhibition: enhancement of GABA activity and potassium channel activation in hypothalamic and arcuate nucleus neurons.
Belousov AB, van den Pol AN. Belousov AB, et al. J Neurophysiol. 1997 Aug;78(2):674-88. doi: 10.1152/jn.1997.78.2.674. J Neurophysiol. 1997. PMID: 9307104
Cited by
- Optogenetic probing of fast glutamatergic transmission from hypocretin/orexin to histamine neurons in situ.
Schöne C, Cao ZF, Apergis-Schoute J, Adamantidis A, Sakurai T, Burdakov D. Schöne C, et al. J Neurosci. 2012 Sep 5;32(36):12437-43. doi: 10.1523/JNEUROSCI.0706-12.2012. J Neurosci. 2012. PMID: 22956835 Free PMC article. - Dynamic sensory representations in the olfactory bulb: modulation by wakefulness and experience.
Kato HK, Chu MW, Isaacson JS, Komiyama T. Kato HK, et al. Neuron. 2012 Dec 6;76(5):962-75. doi: 10.1016/j.neuron.2012.09.037. Neuron. 2012. PMID: 23217744 Free PMC article. - An inhibitory corticostriatal pathway.
Rock C, Zurita H, Wilson C, Apicella AJ. Rock C, et al. Elife. 2016 May 9;5:e15890. doi: 10.7554/eLife.15890. Elife. 2016. PMID: 27159237 Free PMC article. - REV-ERB in GABAergic neurons controls diurnal hepatic insulin sensitivity.
Ding G, Li X, Hou X, Zhou W, Gong Y, Liu F, He Y, Song J, Wang J, Basil P, Li W, Qian S, Saha P, Wang J, Cui C, Yang T, Zou K, Han Y, Amos CI, Xu Y, Chen L, Sun Z. Ding G, et al. Nature. 2021 Apr;592(7856):763-767. doi: 10.1038/s41586-021-03358-w. Epub 2021 Mar 24. Nature. 2021. PMID: 33762728 Free PMC article. - Chemogenetic Tools and their Use in Studies of Neuropsychiatric Disorders.
Neřoldová M, Stuchlík A. Neřoldová M, et al. Physiol Res. 2024 Aug 30;73(S1):S449-S470. doi: 10.33549/physiolres.935401. Epub 2024 Jul 2. Physiol Res. 2024. PMID: 38957949 Free PMC article. Review.
References
- Balthasar N, Coppari R, McMinn J, Liu SM, Lee CE, Tang V, Kenny CD, McGovern RA, Chua SC, Jr, Elmquist JK, Lowell BB. Leptin receptor signaling in POMC neurons is required for normal body weight homeostasis. Neuron. 2004;42:983–991. - PubMed
- Boyden ES, Zhang F, Bamberg E, Nagel G, Deisseroth K. Millisecond-timescale, genetically targeted optical control of neural activity. Nat Neurosci. 2005;8:1263–1268. - PubMed
- Cowley MA, Pronchuk N, Fan W, Dinulescu DM, Colmers WF, Cone RD. Integration of NPY, AGRP, and melanocortin signals in the hypothalamic paraventricular nucleus: evidence of a cellular basis for the adipostat. Neuron. 1999;24:155–163. - PubMed
Publication types
MeSH terms
Substances
LinkOut - more resources
Full Text Sources
Other Literature Sources
Medical
Research Materials


