Role for subthalamic nucleus neurons in switching from automatic to controlled eye movement - PubMed (original) (raw)
Role for subthalamic nucleus neurons in switching from automatic to controlled eye movement
Masaki Isoda et al. J Neurosci. 2008.
Abstract
The subthalamic nucleus (STN) of the basal ganglia is an important element of motor control. This is demonstrated by involuntary movements induced by STN lesions and the successful treatment of Parkinson's disease by STN stimulation. However, it is still unclear how individual STN neurons participate in motor control. Here, we report that the STN has a function in switching from automatic to volitionally controlled eye movement. In the STN of trained macaque monkeys, we found neurons that showed a phasic change in activity specifically before volitionally controlled saccades which were switched from automatic saccades. A majority of switch-related neurons were considered to inhibit no-longer-valid automatic processes, and the inhibition started early enough to enable the animal to switch. We suggest that the STN mediates the control signal originated from the medial frontal cortex and implements the behavioral switching function using its connections with other basal ganglia nuclei and the superior colliculus.
Figures
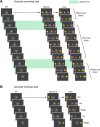
Figure 1.
Behavioral tasks. A, The sequence of events in the saccade overriding task. White dotted circles (invisible to the monkey in actual experiments) indicate the direction of gaze required for the correct responses. Green rectangles indicate switch trials. Note that in the switch trials, the monkey had to switch the saccade from a primed stimulus that had been the target to a nonprimed stimulus that would become the target. B, The sequence of events in the saccade go/no-go task. White dotted circles (invisible to the monkey in actual experiment) indicate the direction of gaze for the correct responses.
Figure 2.
Animal performance in the saccade overriding task. A, Average SRTs (green) and average error rates (orange) plotted against the trial position in each block (n represents the switch trials) for monkey T (left) and monkey S (right). *p < 0.001. B, Distribution of SRTs for the correct switch trials (red) and incorrect switch trials (gray) for monkey T (left; n = 1426 for correct switches and 711 for switch errors) and monkey S (right; n = 1532 for correct switches and 739 for switch errors). Black broken lines represent the behavioral differentiation time (BDT).
Figure 3.
An example of a contra-switch neuron (no-go type). A, Switch-selective activity in the correctly performed saccade overriding task. Rastergrams and SDFs are sorted by the trial position in each block (n represents the switch trials). In the left column, the saccade target was on the contralateral side for both switch trials (n) and nonswitch trials (n − 2, n − 1, n + 1, n + 2); in the right column, the saccade target was on the ipsilateral side for both switch trials and nonswitch trials. Rastergrams and SDFs are aligned with saccade onset. In the rastergrams, small black dots represent the time of individual action potentials and colored dots indicate the time of cue onset; trials are arranged in order of SRTs. B, Ipsilateral no-go activity in the saccade go/no-go task. Rastergrams and SDFs are grouped by the type of trials (go or no-go trials) and the direction of the target. Rastergrams and SDFs are aligned with cue onset. In go trials (top), red dots indicate the time of saccade onset and trials are arranged in order of SRTs.
Figure 4.
An example of an ipsi-switch neuron (no-go type). A, Switch-selective activity in the correctly performed saccade overriding task (same conventions as in Fig. 3_A_). B, Contralateral no-go activity in the saccade go/no-go task (same conventions as in Fig. 3_B_).
Figure 5.
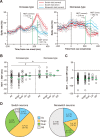
Population summary of switch-selective activity. A, The neuronal differentiation time (NDT) for the population of switch-selective activity. Ensemble-averaged SDFs (mean ± SD) for the increase type (left) and the decrease type (right) in the correct switch trials (red), incorrect switch trials (gray), and correct nonswitch trials (blue) are shown. SDFs are aligned with cue onset. Note that, for this comparison, the direction of the saccade target in the switch trials is opposite that in the nonswitch trials (see Materials and Methods). B, The neuronal differentiation time of individual switch-selective activity for the increase type (left) and decrease type (right). Plotted along the ordinate is the neuronal differentiation time relative to the behavioral differentiation time. Negative values indicate that neuronal differentiation occurred before behavioral differentiation. Switch-selective activity is grouped by its functional subtype. Green horizontal arrows represent the mean. Bilateral-switch neurons yielded two data points. *p < 0.01. C, Comparison of the neuronal differentiation time with the mean SRT obtained from each session. The increase type and decrease type are combined together. Negative values indicate that the neuronal differentiation time preceded the average SRT. Green horizontal arrows represent the group mean. D, Frequency distribution of functional subtypes for switch neurons (left) and nonswitch neurons (right).
Figure 6.
Spatial distribution of switch neurons in the STN (monkey T). A, Photomicrographs of Nissl-stained coronal sections showing the STN and adjacent structures. The white rectangle on the left section outlines the region magnified on the right section. SNc, Substantia nigra pars compacta. Arrowhead, Electrolytic mark. B, Spatial distribution of switch neurons (red circles) and nonswitch neurons (black circles) in the STN. Shown are coronal sections of the right STN arranged rostrocaudally in stereotaxic coordinates from 13 to 16 mm anterior to the level of the ear canal. Each circle represents a single neuron.
Figure 7.
Hypothetical neural circuits for direction-selective no-go and go functions. A, Hypothetical no-go pathways. Red upward arrows indicate excitation of neuronal activity, whereas blue downward arrows indicate inhibition of neuronal activity. Yellow horizontal arrows in the bottom represent a saccade to be suppressed. Shown are the number of switch neurons having each neuronal action. Open circles depict excitatory neurons, whereas black filled circles show inhibitory neurons. B, Hypothetical go pathways (same conventions as in A). Yellow horizontal arrows in the bottom represent a saccade to be facilitated.
Similar articles
- Eye movement-related responses of neurons in human subthalamic nucleus.
Fawcett AP, Dostrovsky JO, Lozano AM, Hutchison WD. Fawcett AP, et al. Exp Brain Res. 2005 Apr;162(3):357-65. doi: 10.1007/s00221-004-2184-7. Epub 2004 Dec 15. Exp Brain Res. 2005. PMID: 15599721 - Reward-related neuronal activity in the subthalamic nucleus of the monkey.
Darbaky Y, Baunez C, Arecchi P, Legallet E, Apicella P. Darbaky Y, et al. Neuroreport. 2005 Aug 1;16(11):1241-4. doi: 10.1097/00001756-200508010-00022. Neuroreport. 2005. PMID: 16012357 - Connectivity and Dynamics Underlying Synaptic Control of the Subthalamic Nucleus.
Steiner LA, Barreda Tomás FJ, Planert H, Alle H, Vida I, Geiger JRP. Steiner LA, et al. J Neurosci. 2019 Mar 27;39(13):2470-2481. doi: 10.1523/JNEUROSCI.1642-18.2019. Epub 2019 Jan 30. J Neurosci. 2019. PMID: 30700533 Free PMC article. - Subthalamic nucleus and globus pallidus interna influence firing of tonically active neurons in the primate striatum through different mechanisms.
Nakajima A, Shimo Y, Uka T, Hattori N. Nakajima A, et al. Eur J Neurosci. 2017 Dec;46(11):2662-2673. doi: 10.1111/ejn.13726. Epub 2017 Oct 20. Eur J Neurosci. 2017. PMID: 28949036 Free PMC article. - Activity of substantia nigra pars reticulata neurons during smooth pursuit eye movements in monkeys.
Basso MA, Pokorny JJ, Liu P. Basso MA, et al. Eur J Neurosci. 2005 Jul;22(2):448-64. doi: 10.1111/j.1460-9568.2005.04215.x. Eur J Neurosci. 2005. PMID: 16045498
Cited by
- Effects of lesions of the subthalamic nucleus/zona incerta area and dorsomedial striatum on attentional set-shifting in the rat.
Tait DS, Phillips JM, Blackwell AD, Brown VJ. Tait DS, et al. Neuroscience. 2017 Mar 14;345:287-296. doi: 10.1016/j.neuroscience.2016.08.008. Epub 2016 Aug 12. Neuroscience. 2017. PMID: 27522961 Free PMC article. - Individual differences in the effect of menstrual cycle on basal ganglia inhibitory control.
Hidalgo-Lopez E, Pletzer B. Hidalgo-Lopez E, et al. Sci Rep. 2019 Jul 30;9(1):11063. doi: 10.1038/s41598-019-47426-8. Sci Rep. 2019. PMID: 31363112 Free PMC article. - Deep brain stimulation of the subthalamic nucleus alters the cortical profile of response inhibition in the beta frequency band: a scalp EEG study in Parkinson's disease.
Swann N, Poizner H, Houser M, Gould S, Greenhouse I, Cai W, Strunk J, George J, Aron AR. Swann N, et al. J Neurosci. 2011 Apr 13;31(15):5721-9. doi: 10.1523/JNEUROSCI.6135-10.2011. J Neurosci. 2011. PMID: 21490213 Free PMC article. - On the role of the striatum in response inhibition.
Zandbelt BB, Vink M. Zandbelt BB, et al. PLoS One. 2010 Nov 4;5(11):e13848. doi: 10.1371/journal.pone.0013848. PLoS One. 2010. PMID: 21079814 Free PMC article. Clinical Trial. - Chemogenetic dissection of a prefrontal-hypothalamic circuit for socially subjective reward valuation in macaques.
Noritake A, Ninomiya T, Kobayashi K, Isoda M. Noritake A, et al. Nat Commun. 2023 Jul 20;14(1):4372. doi: 10.1038/s41467-023-40143-x. Nat Commun. 2023. PMID: 37474519 Free PMC article.
References
- Alexander GE, DeLong MR, Strick PL. Parallel organization of functionally segregated circuits linking basal ganglia and cortex. Annu Rev Neurosci. 1986;9:357–381. - PubMed
- Bauswein E, Fromm C, Preuss A. Corticostriatal cells in comparison with pyramidal tract neurons: contrasting properties in the behaving monkey. Brain Res. 1989;493:198–203. - PubMed
Publication types
MeSH terms
LinkOut - more resources
Full Text Sources
Other Literature Sources


