Restoration of MRI data for intensity non-uniformities using local high order intensity statistics - PubMed (original) (raw)
Restoration of MRI data for intensity non-uniformities using local high order intensity statistics
Stathis Hadjidemetriou et al. Med Image Anal. 2009 Feb.
Abstract
MRI at high magnetic fields (>3.0 T) is complicated by strong inhomogeneous radio-frequency fields, sometimes termed the "bias field". These lead to non-biological intensity non-uniformities across the image. They can complicate further image analysis such as registration and tissue segmentation. Existing methods for intensity uniformity restoration have been optimized for 1.5 T, but they are less effective for 3.0 T MRI, and not at all satisfactory for higher fields. Also, many of the existing restoration algorithms require a brain template or use a prior atlas, which can restrict their practicalities. In this study an effective intensity uniformity restoration algorithm has been developed based on non-parametric statistics of high order local intensity co-occurrences. These statistics are restored with a non-stationary Wiener filter. The algorithm also assumes a smooth non-uniformity and is stable. It does not require a prior atlas and is robust to variations in anatomy. In geriatric brain imaging it is robust to variations such as enlarged ventricles and low contrast to noise ratio. The co-occurrence statistics improve robustness to whole head images with pronounced non-uniformities present in high field acquisitions. Its significantly improved performance and lower time requirements have been demonstrated by comparing it to the very commonly used N3 algorithm on BrainWeb MR simulator images as well as on real 4 T human head images.
Figures
Fig. 1
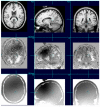
Example phantom T1 images from the BrainWeb MR simulator. In the first row in (a) is the true phantom, in the second row is a phantom image without intensity non-uniformity but with high superimposed noise, and in the third row is a phantom with high non-uniformity and some superimposed noise. Next to each image in (b) is its co-occurrence density matrix. In (c) are their corresponding restoration matrices where the gain factors are linearly proportional to the intensities.
Fig. 2
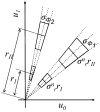
The shape of the Wiener restoration filter in both the radial r and angular ϕ dimensions.
Fig. 3
The radial and angular sizes of the non-stationary Wiener restoration filter fq depend on the position of its center point in the co-occurrence matrix.
Fig. 4
The first row shows a BrainWeb phantom with both high non-uniformity B = 40% and high noise _N_I = 5%. The second row shows the rough estimate of its non-uniformity and in the third row is the smooth estimate of its non-uniformity.
Fig. 5
A block summary of the algorithm.
Fig. 6
The error images of the restorations of the BrainWeb MR phantoms corrupted with a non-uniformity of 40% and a noise level of 5% for T1, T2, and PD are in (a), (b), and (c), respectively. The first column shows the original corrupted phantom. In the second column is the true non-uniformity field. The remaining two columns show the error images for the N3 and the co-occurrence restorations, respectively. The dynamic range used for the display of both error images is the same. In all cases the error images resulting from the N3 restorations are brighter which correspond to higher error.
Fig. 7
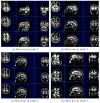
Examples of restorations of four of the 4 T human head images given in Table 7. In each example the first row shows the acquired image, the second row shows the correction with N3, and in the third row is the restoration with the co-occurrence algorithm. The N3 restoration contains a considerable residual of the non-uniformity and sometimes it even accentuates the non-uniformity. It also darkens the white matter and introduces overshooting contours around the borders between regions with different intensities such as between the gray matter and the white matter at the cortex. The higher uniformity of the white matter intensity seen in the images corrected with the co-occurrence algorithm is an indication of its improved performance.
Fig. 8
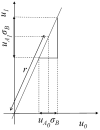
Radial standard deviation of a tissue distribution due to intensity non-uniformity.
Fig. 9
The effect of intensity non-uniformity on the angular spread of the co-occurrences and the size of the Wiener restoration filter.
Similar articles
- Joint restoration of bi-contrast MRI data for spatial intensity non-uniformities.
Hadjidemetriou S, Buechert M, Ludwig U, Hennig J. Hadjidemetriou S, et al. Inf Process Med Imaging. 2011;22:346-58. doi: 10.1007/978-3-642-22092-0_29. Inf Process Med Imaging. 2011. PMID: 21761669 - Robust brain registration using adaptive probabilistic atlas.
Ide J, Chen R, Shen D, Herskovits EH. Ide J, et al. Med Image Comput Comput Assist Interv. 2008;11(Pt 2):1041-9. doi: 10.1007/978-3-540-85990-1_125. Med Image Comput Comput Assist Interv. 2008. PMID: 18982707 Free PMC article. - Nonparametric neighborhood statistics for MRI denoising.
Awate SP, Whitaker RT. Awate SP, et al. Inf Process Med Imaging. 2005;19:677-88. doi: 10.1007/11505730_56. Inf Process Med Imaging. 2005. PMID: 17354735 - Unifying framework for multimodal brain MRI segmentation based on Hidden Markov Chains.
Bricq S, Collet Ch, Armspach JP. Bricq S, et al. Med Image Anal. 2008 Dec;12(6):639-52. doi: 10.1016/j.media.2008.03.001. Epub 2008 Mar 17. Med Image Anal. 2008. PMID: 18440268 - Stable Atlas-based Mapped Prior (STAMP) machine-learning segmentation for multicenter large-scale MRI data.
Kim EY, Magnotta VA, Liu D, Johnson HJ. Kim EY, et al. Magn Reson Imaging. 2014 Sep;32(7):832-44. doi: 10.1016/j.mri.2014.04.016. Epub 2014 May 9. Magn Reson Imaging. 2014. PMID: 24818817 Free PMC article.
Cited by
- Virtual phantom methodology for assessment of MRI distortion correction in high-precision stereotactic radiosurgery treatment planning.
Belloeil-Marrane T, Gutierrez A, Boussaer M, Teixeira C, Gevaert T, De Ridder M. Belloeil-Marrane T, et al. Front Oncol. 2025 May 21;15:1530332. doi: 10.3389/fonc.2025.1530332. eCollection 2025. Front Oncol. 2025. PMID: 40469181 Free PMC article. - Associations between white matter hyperintensities and β amyloid on integrity of projection, association, and limbic fiber tracts measured with diffusion tensor MRI.
Chao LL, Decarli C, Kriger S, Truran D, Zhang Y, Laxamana J, Villeneuve S, Jagust WJ, Sanossian N, Mack WJ, Chui HC, Weiner MW. Chao LL, et al. PLoS One. 2013 Jun 6;8(6):e65175. doi: 10.1371/journal.pone.0065175. Print 2013. PLoS One. 2013. PMID: 23762308 Free PMC article. - Volumetric analysis of MRI data monitoring the treatment of polycystic kidney disease in a mouse model.
Hadjidemetriou S, Reichardt W, Hennig J, Buechert M, von Elverfeldt D. Hadjidemetriou S, et al. MAGMA. 2011 Apr;24(2):109-19. doi: 10.1007/s10334-010-0240-9. Epub 2011 Jan 7. MAGMA. 2011. PMID: 21213015 - The role of carotid intima-media thickness in predicting longitudinal cognitive function in an older adult cohort.
Frazier DT, Seider T, Bettcher BM, Mack WJ, Jastrzab L, Chao L, Weiner MW, DeCarli C, Reed BR, Mungas D, Chui HC, Kramer JH. Frazier DT, et al. Cerebrovasc Dis. 2014;38(6):441-7. doi: 10.1159/000366469. Epub 2014 Dec 11. Cerebrovasc Dis. 2014. PMID: 25502351 Free PMC article. - Fast algorithm for calculation of inhomogeneity gradient in magnetic resonance imaging data.
Hui C, Zhou YX, Narayana P. Hui C, et al. J Magn Reson Imaging. 2010 Nov;32(5):1197-208. doi: 10.1002/jmri.22344. J Magn Reson Imaging. 2010. PMID: 21031526 Free PMC article.
References
- Ahmed M, Yamany S, Mohamed N, Farag A, Moriarty T. A modified fuzzy c-means algorithm for bias field estimation and segmentation of MRI data. IEEE Transactions on Medical Imaging. 2002;21(3):193–199. - PubMed
- Arnold J, Liow J, Schaper K, Stern J, Sled J, Shattuck D, Worth A, Cohen M, Leahy R, Mazziota J, Rottenberg D. Qualitative and quantitative evaluation of six algorithms for correcting intensity nonuniformity effects. NeuroImage. 2001;13:931–943. - PubMed
- Ashburner A, Friston K. Voxel-based morphometry–the methods. NeuroImage. 2000;11:805–821. - PubMed
- Axel L, Costantini J, Listerud J. Intensity correction in surface-coil MR imaging. American Journal of Roentgenology. 1987;148:418–420. - PubMed
- Bansal R, Staib L, Peterson B. Correcting nonuniformities in MRI intensities using entropy minimization based on an elastic model; Proceedings of MICCAI; 2004.
Publication types
MeSH terms
LinkOut - more resources
Full Text Sources
Medical


