Genomic analysis reveals age-dependent innate immune responses to severe acute respiratory syndrome coronavirus - PubMed (original) (raw)
Genomic analysis reveals age-dependent innate immune responses to severe acute respiratory syndrome coronavirus
Tracey Baas et al. J Virol. 2008 Oct.
Abstract
The relationship between immunosenescence and the host response to virus infection is poorly understood at the molecular level. Two different patterns of pulmonary host responses to virus were observed when gene expression profiles from severe acute respiratory syndrome coronavirus (SARS-CoV)-infected young mice that show minimal disease were compared to those from SARS-CoV-infected aged mice that develop pneumonitis. In young mice, genes related to cellular development, cell growth, and cell cycle were downregulated during peak viral replication, and these transcripts returned to basal levels as virus was cleared. In contrast, aged mice had a greater number of upregulated immune response and cell-to-cell signaling genes, and the expression of many genes was sustained even after viral clearance, suggesting an exacerbated host response to virus. Interestingly, in SARS-CoV-infected aged mice, a subset of genes, including Tnfa, Il6, Ccl2, Ccl3, Cxcl10, and Ifng, was induced in a biphasic pattern that correlated with peak viral replication and a subsequent influx of lymphocytes and severe histopathologic changes in the lungs. We provide insight into gene expression profiles and molecular signatures underlying immunosenescence in the context of the host response to viral infection.
Figures
FIG. 1.
Aged mice show a delay in viral clearance and a greater number of differentially regulated host cellular genes than young mice after SARS-CoV infection. (A) Characterization of SARS-CoV infection in young and old mice as reported previously by Subbarao et al. (35) and Roberts et al. (30). Plus signs indicate the presence of a finding, and minus signs indicate the absence of a finding. na, not applicable; nd, not done. The mean virus titer is expressed as the log10 50% tissue culture infective dose per gram of tissue. In aged mice, day 1 titers are typically 1-log lower than day 2 titers and day 7 titers are near or below the limit of detection. (B) The number of cellular genes differentially expressed in lung tissues is the result of comparing gene expression in lungs of experimentally infected mice (pooled, n = 4) with gene expression in lungs of mock-infected mice (pooled, n = 5); genes were included (y axis) if they met the criteria of an absolute fold change of ≥2 and P ≤ 0.01 for young (open) and old (gray) SARS-CoV-infected mice on the indicated days (x axis). (C) Global gene expression profiles are the results of comparing gene expression in lungs of experimentally infected mice (pooled, n = 4) with gene expression in lungs of mock-infected mice (pooled, n = 5); genes were included if they met the criteria of an absolute fold change of ≥2 and P ≤ 0.01 in at least one experiment. The data are presented for young (Y) and aged (A) mice on indicated days (D) 1, 2, 5, and 7 postinfection. These data were plotted as a heat map, where each matrix entry represents a gene expression value. Red corresponds to higher gene expression than that of the reference; green corresponds to lower gene expression. Dendrograms (trees) of the heat map represent the degree of relatedness between the samples, with short branches denoting a high degree of similarity and long branches denoting a low degree of similarity. Heat maps from young (541 sequences) and aged (1,735 sequences) mice were created individually because each set was compared to its age-matched mock-infected reference.
FIG. 2.
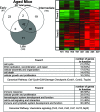
Young SARS-CoV-infected mice showed a prominent response at early time points and throughout the course of infection. Early, intermediate, and late genes were defined in the text. Briefly, genes shown in the Venn diagram and subsequent heat map met the criteria of an absolute fold change of ≥2 and P ≤ 0.01 in at least two time points. Early genes met the criteria on both days 1 and 2, intermediate genes met the criteria on both days 2 and 5, and late genes met the criteria on both days 5 and 7 postinfection. Therefore, this representation is a subset of the global gene expression seen in Fig. 1C. Gene expression profiles are the result of comparing gene expression in the lungs of experimentally infected mice (pooled, n = 4) with gene expression in the lungs of mock-infected mice (pooled, n = 5) The Venn diagram uses three circles, representing each time definition, to show the degree of overlap of gene expression. A total of 196 genes is shown in the Venn diagram of the young SARS-CoV-infected mice, with the most prominent gene responses seen at early time points (52 sequences, no overlap) and throughout the course of infection (55 sequences, overlap of early, intermediate, and late). The data for these most-prominent responses (colored gray in the Venn diagram) are next presented as a heat map for young (Y) mice on indicated days (D) 1, 2, 5, and 7 postinfection. The same genes for aged (A) mice are also included in the heat map for comparison. These genes in the heat map are primarily downregulated (trend 1) in young mice and are inversely correlated in aged mice. Predominant functional annotations, as well as the top canonical pathways, are shown in the trend 1 table. Functional annotation was generated by using Ingenuity Pathway Analysis as described in the text. The percentage was calculated by using the total number of genes in each functionality group and the total number of genes that could be functionally annotated. Heat maps of all of the areas in the Venn diagram are given in Fig. S3 in the supplemental material.
FIG. 3.
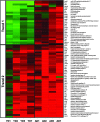
Aged SARS-CoV-infected mice showed a prominent response at late time points and throughout the course of infection. Early, intermediate, and late genes were defined in the text. Briefly, genes shown in the Venn diagram and subsequent heat map each met the criteria of an absolute fold change of ≥2 and P ≤ 0.01 in at least two time points. Early genes met the criteria on both days 1 and 2, intermediate genes met the criteria on both days 2 and 5, and late genes met the criteria on both days 5 and 7 postinfection. Therefore, this representation is a subset of the global gene expression present in Fig. 1C. Gene expression profiles are the result of comparing gene expression in RNA pooled from the lungs of four experimentally infected mice at each time point with gene expression in the lungs of mock-infected mice (pooled, n = 5). The Venn diagram uses three circles, representing each time definition, to show the degree of overlap of gene expression. A total of 237 genes are shown in the Venn diagram of the SARS-CoV-infected aged mice, with the most prominent gene responses seen at late time points (80 gene sequences, overlap of intermediate and late; and 71 sequences, no overlap) and throughout the course of infection (42 sequences, overlap of early, intermediate, and late). The data for these most prominent responses (colored gray in the Venn diagram) are next presented as a heat map for aged (A) mice on indicated days (D) 1, 2, 5, and 7 postinfection. The same genes for young (Y) mice are also included in the heat map for comparison. Trend 1 shows an inverse correlation between the responses of aged and young mice to SARS-CoV infection, and the predominant functional annotations and top canonical pathways are shown in the trend 1 table. Trend 2 shows a correlation between the responses of aged and young mice to SARS-CoV infection, and the predominant functional annotations and top canonical pathways are shown in the trend 2 table. Functional annotation was generated by using Ingenuity Pathway Analysis as described in the text. The percentage was calculated by using the total number of genes in each functionality group and the total number of genes that could be functionally annotated. Heat maps of all of the areas in the Venn diagram are found in Fig. S4 in the supplemental material.
FIG. 4.
A small set of genes are affected in both aged and young mice during SARS-CoV infection The heat map shows genes that met the criteria of an absolute fold change of ≥2 and P ≤ 0.01 criteria in both the aged 237 gene set and the young 196 gene set. Gene expression profiles are the result of comparing gene expression in RNA pooled from lungs of four experimentally infected mice at each time point with gene expression in the lungs of mock-infected mice (pooled, n = 5). The data are presented for young (Y) and aged (A) mice on indicated days (D) 1, 2, 5, and 7 postinfection. Genes that are predominantly related to cell cycle functions were inversely correlated between aged and young mice in trend 1. Trend 2 shows the correlation between aged and young, with the predominant function being immune response.
FIG. 5.
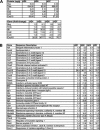
Biphasic induction of mRNA in aged SARS-CoV-infected mice. (A) Protein and mRNA levels of indicated cytokines and chemokines in aged SARS-CoV-infected mice on the indicated days postinfection. The data are presented for aged (A) mice on indicated days (D) 1, 2, 5, and 7 postinfection. Gene transcripts (fold change) showed biphasic responses similar to those observed with protein levels (ng of cytokine per g of lung tissue). Although Ifng did not show a biphasic protein response, the gene showed biphasic transcript. Fold changes of transcripts are the result of comparing the gene expression in the lungs of experimentally infected mice (pooled, n = 4) with the gene expression in the lungs of mock-infected mice (pooled, n = 5). Concentration of cytokines are the results of cytokine bead assays. (B) Graph showing the fold change in genes exhibiting a biphasic response on the indicated days postinfection. Each line represents an individual gene. Using the criteria of a fold change of ≥2 at day 2, a decrease in fold change at day 5, and a fold changeday 7/fold changeday 5 ratio of ≥2, 33 genes were defined as showing a biphasic response.
FIG. 6.
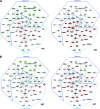
(A) At the time of peak viral replication, aged and young mice present different “top” networks. A network is a group of biologically related genes that is derived from known relationships present in the Ingenuity Pathways Knowledge Base. These diagrams, which comprise the two top networks, represent the interactions, both direct (solid lines) and indirect (dashed lines), between genes and gene products identified during peak viral replication. Network 1 was the most prominent network detected at day 2 in young SARS-CoV-infected mice and was composed of cell cycle, cellular development, and hematological system development functions. Network 2 was the most prominent network detected at day 2 in aged SARS-CoV-infected mice and was composed of immune response, inflammatory response, and cell-to-cell signaling functions. Young mice show network 1 to be downregulated, and although aged mice show a very strong induction of network 2, young mice also induce this network. Dark red indicates a fold change of ≥5, pink indicates a fold change of ≥2, and gray indicates a fold change of <2. Dark green indicates a fold change of ≥5, light green indicates a fold change of ≥2, and gray indicates an absolute fold change of <2. Gene expression profiles are the result of comparing gene expression in the lungs of experimentally infected mice (pooled, n = 4) with gene expression in the lungs of mock-infected mice (pooled, n = 5). (B) Network interactions at day 7 postinfection when SARS-CoV is cleared from the lungs. This is the same merged network shown in Fig. 6A. Again, young mice showed a prominent downregulation at day 7 but also seem to show a trend of returning to levels seen in mock-infected animals. Aged SARS-CoV-infected mice show an increase of transcripts in network 1 and a continued strong induction of network 2 at day 7. Dark red indicates a fold change of ≥5, pink indicates a fold change of ≥2, and gray indicates a fold change of <2. Dark green indicates a fold change of ≥5, light green indicates a fold change of ≥ 2, and gray indicates an absolute fold change of <2. Gene expression profiles are the result of comparing gene expression in the lungs of experimentally infected mice (pooled, n = 4) with gene expression in the lungs of mock-infected mice (pooled, n = 5).
Similar articles
- Cellular immune responses to severe acute respiratory syndrome coronavirus (SARS-CoV) infection in senescent BALB/c mice: CD4+ T cells are important in control of SARS-CoV infection.
Chen J, Lau YF, Lamirande EW, Paddock CD, Bartlett JH, Zaki SR, Subbarao K. Chen J, et al. J Virol. 2010 Feb;84(3):1289-301. doi: 10.1128/JVI.01281-09. Epub 2009 Nov 11. J Virol. 2010. PMID: 19906920 Free PMC article. - Mechanisms of host defense following severe acute respiratory syndrome-coronavirus (SARS-CoV) pulmonary infection of mice.
Glass WG, Subbarao K, Murphy B, Murphy PM. Glass WG, et al. J Immunol. 2004 Sep 15;173(6):4030-9. doi: 10.4049/jimmunol.173.6.4030. J Immunol. 2004. PMID: 15356152 - Cytokine responses in severe acute respiratory syndrome coronavirus-infected macrophages in vitro: possible relevance to pathogenesis.
Cheung CY, Poon LL, Ng IH, Luk W, Sia SF, Wu MH, Chan KH, Yuen KY, Gordon S, Guan Y, Peiris JS. Cheung CY, et al. J Virol. 2005 Jun;79(12):7819-26. doi: 10.1128/JVI.79.12.7819-7826.2005. J Virol. 2005. PMID: 15919935 Free PMC article. - Human Coronavirus: Host-Pathogen Interaction.
Fung TS, Liu DX. Fung TS, et al. Annu Rev Microbiol. 2019 Sep 8;73:529-557. doi: 10.1146/annurev-micro-020518-115759. Epub 2019 Jun 21. Annu Rev Microbiol. 2019. PMID: 31226023 Review. - Interferon and cytokine responses to SARS-coronavirus infection.
Thiel V, Weber F. Thiel V, et al. Cytokine Growth Factor Rev. 2008 Apr;19(2):121-32. doi: 10.1016/j.cytogfr.2008.01.001. Epub 2008 Mar 5. Cytokine Growth Factor Rev. 2008. PMID: 18321765 Free PMC article. Review.
Cited by
- Animal models for SARS and MERS coronaviruses.
Gretebeck LM, Subbarao K. Gretebeck LM, et al. Curr Opin Virol. 2015 Aug;13:123-9. doi: 10.1016/j.coviro.2015.06.009. Epub 2015 Jul 14. Curr Opin Virol. 2015. PMID: 26184451 Free PMC article. Review. - Exacerbated innate host response to SARS-CoV in aged non-human primates.
Smits SL, de Lang A, van den Brand JM, Leijten LM, van IJcken WF, Eijkemans MJ, van Amerongen G, Kuiken T, Andeweg AC, Osterhaus AD, Haagmans BL. Smits SL, et al. PLoS Pathog. 2010 Feb 5;6(2):e1000756. doi: 10.1371/journal.ppat.1000756. PLoS Pathog. 2010. PMID: 20140198 Free PMC article. - Understanding the age divide in COVID-19: why are children overwhelmingly spared?
Lingappan K, Karmouty-Quintana H, Davies J, Akkanti B, Harting MT. Lingappan K, et al. Am J Physiol Lung Cell Mol Physiol. 2020 Jul 1;319(1):L39-L44. doi: 10.1152/ajplung.00183.2020. Epub 2020 Jun 3. Am J Physiol Lung Cell Mol Physiol. 2020. PMID: 32491949 Free PMC article. - Devilishly radical NETwork in COVID-19: Oxidative stress, neutrophil extracellular traps (NETs), and T cell suppression.
Schönrich G, Raftery MJ, Samstag Y. Schönrich G, et al. Adv Biol Regul. 2020 Aug;77:100741. doi: 10.1016/j.jbior.2020.100741. Epub 2020 Jul 4. Adv Biol Regul. 2020. PMID: 32773102 Free PMC article. Review. - Immunesenescence: A Predisposing Risk Factor for the Development of COVID-19?
Hazeldine J, Lord JM. Hazeldine J, et al. Front Immunol. 2020 Oct 6;11:573662. doi: 10.3389/fimmu.2020.573662. eCollection 2020. Front Immunol. 2020. PMID: 33123152 Free PMC article. Review.
References
- Brazma, A., P. Hingamp, J. Quackenbush, G. Sherlock, P. Spellman, C. Stoeckert, J. Aach, W. Ansorge, C. A. Ball, H. C. Causton, T. Gaasterland, P. Glenisson, F. C. Holstege, I. F. Kim, V. Markowitz, J. C. Matese, H. Parkinson, A. Robinson, U. Sarkans, S. Schulze-Kremer, J. Stewart, R. Taylor, J. Vilo, and M. Vingron. 2001. Minimum information about a microarray experiment (MIAME)-toward standards for microarray data. Nat. Genet. 29365-371. - PubMed
- Cella, M., D. Jarrossay, F. Facchetti, O. Alebardi, H. Nakajima, A. Lanzavecchia, and M. Colonna. 1999. Plasmacytoid monocytes migrate to inflamed lymph nodes and produce large amounts of type I interferon. Nat. Med. 5919-923. - PubMed
- Chipman, H., T. J. Hastie, and R. Tibshirani. 2003. Clustering microarray data. CRC Press, New York, NY.
Publication types
MeSH terms
Substances
Grants and funding
- R01 HL080621-01/HL/NHLBI NIH HHS/United States
- P51 RR000166/RR/NCRR NIH HHS/United States
- R01 HL080621/HL/NHLBI NIH HHS/United States
- ImNIH/Intramural NIH HHS/United States
- P51 RR00166-45/RR/NCRR NIH HHS/United States
LinkOut - more resources
Full Text Sources
Medical
Miscellaneous


