Differentiated murine airway epithelial cells synthesize a leukocyte-adhesive hyaluronan matrix in response to endoplasmic reticulum stress - PubMed (original) (raw)
Differentiated murine airway epithelial cells synthesize a leukocyte-adhesive hyaluronan matrix in response to endoplasmic reticulum stress
Mark E Lauer et al. J Biol Chem. 2008.
Abstract
In this report, we describe a novel method for culturing murine trachea epithelial cells on a native basement membrane at an air-liquid interface to produce a pseudostratified, differentiated airway epithelium composed of ciliated and nonciliated cells. This model was used to examine hyaluronan synthesis by the airway epithelial cells (AECs) in response to poly(I,C) and tunicamycin. The former induces a response similar to viral infection, and the latter is a bacterial toxin known to induce endoplasmic reticulum (ER) stress. We found significant accumulation of hyaluronan on the apical surface of the AECs in response to ER stress, but, unlike previously reported results with smooth muscle cells, no increase in hyaluronan was observed in response to poly(I,C). Monocytic U937 cells adhered at 4 degrees C to the apical surface of the AECs subjected to ER stress by a mechanism almost entirely mediated by hyaluronan. The U937 cells spontaneously released themselves from the abnormal hyaluronan matrix when their metabolism was restored by shifting the temperature from 4 to 37 degrees C in a custom-made flow chamber. Time lapse confocal microscopy permitted live imaging of this interaction between the U937 cells and the hyaluronan matrix and their subsequent response at 37 degrees C. Within 45 min, we observed dynamic protrusions of the U937 cell plasma membrane into nearby hyaluronan matrix, resulting in the degradation of this matrix. Simultaneously, we observed some reorganization of the hyaluronan matrix, from a generalized, apical distribution to localized regions around the AEC tight junctions. We discuss the implications these results might have for the airway epithelium and its relation to airway inflammation and hyperresponsiveness associated with asthma and other airway diseases.
Figures
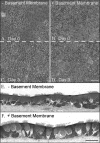
FIGURE 1.
Murine airway epithelial cell morphology when cultured on a native basement membrane compared with a native collagen gel. Epithelial cells were seeded, at the same density, in culture inserts containing BM (B, D, and F) or on a collagen gel (A, C, and E) (for A-D, magnificaton is ×10, and magnificaton bar is 100 μm for A-D; for E-F, magnification is ×40, and the magnificaton bar is 100 μm). The day after seeding (day 0), a confluent monolayer of cells was observed on the BM (B), whereas patches of cells were observed on the collagen gel (A). Three days later, the patches of cells on the collagen gel spread out to confluence (C), whereas the cells on the BM showed little change from day 0 (D). This experiment was repeated three times. Two weeks later, the epithelial cells cultured onaBM(F) were a ciliated, pseudostratified, confluent monolayer portraying a regular basal surface. Cells cultured on a collagen gel (E) were also ciliated and mostly pseudostratified, but the confluence showed some multilayer stratification and an irregular basal surface in the absence of the BM.
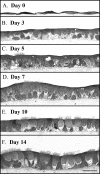
FIGURE 2.
Murine airway epithelial cell differentiation time course on a native basement membrane. Epithelial cells were harvested 0, 3, 5, 7, 10, and 14 days after exposure to an air-liquid interface (A-F, respectively). Differentiation progressed from squamous (day 0) to cuboidal (day 3) to pseudostratified (days 5-14). Cilia formation was apparent by day 5 and reached a plateau between 10 and 14 days. Magnification is ×40.Magnification bar, 100 μm.
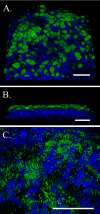
FIGURE 3.
Three-dimensional confocal images of differentiated murine airway epithelial cells cultured on a native basement membrane. Cilia are highlighted by β-tubulin IV staining (green), and DAPI-stained nuclei are blue. A, the apical surface of the epithelial cells (magnification is ×63). B, a lateral cross-section of the epithelial cells (magnification is ×63). C, the apical surface zoomed from ×63 to ×∼160, where the gain for the green channel was lowered to highlight individual cilia. All magnification bars are 50 μm. This experiment was repeated >10 times.
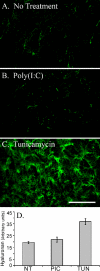
FIGURE 4.
Differentiated murine airway epithelial cells produce hyaluronan on their apical surface in response to tunicamycin but not poly(I,C). The epithelial cells were treated without (A) or with poly(I,C) (B) or tunicamycin (C) for 18 h and processed for confocal microscopy while still alive. Significant amounts of hyaluronan (green) accumulated on the apical surface of the epithelial cells, treated with tunicamycin, when compared with the untreated (A) or poly(I,C)-treated (B) cells. This experiment was repeated four times. Magnification is ×40. Magnification bar, 100 μm. The hyaluronan of untreated (NT), poly(I,C)-treated (PIC), or tunicamycin-treated (TUN) epithelial cells was labeled with biotinylated hyaluronan-binding protein and streptavidin Alexa Fluor ® 488 nm. This labeled hyaluronan was digested with Streptomyces hyaluronidase to remove extracellular hyaluronan, and the extracts were measured on a fluorometer (D). Error bars, S.D. (n = 3).
FIGURE 5.
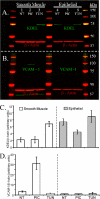
Differential VCAM-1 production between murine airway smooth muscle and epithelial cells in response to poly(I,C). Airway smooth muscle and epithelial cells were treated without (NT; lanes 1 and_4_) or with poly(I,C) (PIC; lanes 2 and 5) or tunicamycin (TUN; lanes 3 and 6). These blots were probed with antibodies against KDEL (A, green) and VCAM-1 (B, green). Molecular weight ladders are shown in_red_/yellow. β-Actin (red) is shown for each lane as a loading control. The KDEL and VCAM bands (A and B, respectively) were quantified and presented in C and D, respectively. Error bars, S.D. (n = 3).
FIGURE 6.
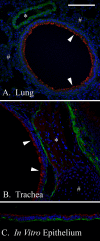
KDEL and hyaluronan in vivo and in vitro airway distribution. Paraffin sections from murine lung (A), trachea (B), or our in vitro differentiated airway epithelial model (C), were probed with an antibody against the tetrapeptide KDEL (red) and a hyaluronan-binding protein (green). Nuclei are_blue. In vivo_ airway epithelial KDEL (arrows) presents higher expression than nearby alveolar cells (pound signs) or venules (asterisk) in the lung (A) as well as nearby smooth muscle cells (asterisk) or cartilage (pound sign) in the trachea (B). KDEL expression in our in vitro, differentiated AEC model (C) was similar to the trachea from which it was derived (B) (both the green and red channels were treated equally). Hyaluronan (green) distribution was primarily localized to the basal surface of the unstimulated AECs, with lesser quantities dispersed between the cells. Magnification is ×40. Magnification bar, 100 μm.
FIGURE 7.
U937 monocytic cells bind to hyaluronan on the apical surface of differentiated murine airway epithelial cells treated with tunicamycin. CM-DiI-labeled U937 cells (red) were applied to the apical surface of epithelial cells treated without (A) or with poly(I,C) (B) or tunicamycin (C). After U937 binding and removal of unbound cells, hyaluronan (green) was labeled with fluorescence-tagged streptavidin on a biotinylated hyaluronan binding protein (at 4 °C), and confocal images were taken of the live cells within the first 30 min of exposure to room temperature. Magnification is ×40. Magnification bars, 100 μm. In parallel cultures, the CM-DiI-labeled U937 cells (bound to hyaluronan) were released by Streptomyces hyaluronidase digestion. U937 cells not released by hyaluronidase digestion were extracted with a detergent (1% Triton X-100 in PBS). The hyaluronidase (white bars) and detergent (gray bars) extracts were measured on a fluorometer, and the results are presented in D (n = 5 for experiments performed on five different days). Error bars, S.D.
FIGURE 8.
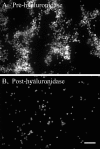
U937 monocytic cells bound to hyaluronan on the apical surface of differentiated murine epithelial cells, treated with tunicamycin, are washed away following hyaluronidase digestion. CM-DiI-labeled U937 cells (shown in white) were applied to tunicamycin-treated epithelial cells (shown in black) at 4 °C and subjected to gentle flow in a custom-made flow chamber. Images were taken (2 images/s) before (A) and after (B) hyaluronidase digestion (also at 4 °C). A movie of this process was generated, which illustrates the three-dimensional structure of the hyaluronan “cables” that readily bind the U937 cells (see supplemental movie S8). In the movie, a time stamp (lower right) can be used to follow the application of the hyaluronidase (∼110 s) and the time at which the medium flow was resumed after the addition of the enzyme (∼160 s). Magnification is ×10. Magnification bar, 100 μm. This experiment was repeated four times.
FIGURE 9.
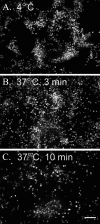
U937 monocytic cells bound to hyaluronan on the apical surface of differentiated murine airway epithelial cells, treated with tunicamycin, are washed away when warmed to 37 °C. Similar to Fig. 8, CM-DiI-labeled U937 cells (shown in white) were applied to the apical surface of tunicamycin-treated epithelial cells (shown in black) at 4 °C and subjected to gentle flow in a custom-made flow chamber. Images were taken (1 image/s) while the flow medium was kept at 4 °C for ∼1 min (A) and subsequently switched to 37 °C medium for 3 min (B) and 10 min (C). A movie portraying the release of the U937 cells following this temperature shift was generated (see supplemental movie S9). In the movie, a time stamp (lower right) can be used to follow the application of the 37 °C medium (∼150 s). Magnification is ×10. Magnification bar, 100 μm. This experiment was repeated three times.
FIGURE 10.
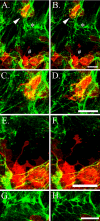
U937 monocytic cells bound to hyaluronan on the apical surface of differentiated murine airway epithelial cells, treated with tunicamycin, degrade hyaluronan when warmed to 37 °C. CM-DiI-labeled U937 cells (red) were applied to the apical surface of tunicamycin-treated epithelial cells (black) at 4 °C, and unbound cells were removed with gentle washing. Subsequently, hyaluronan (green) was labeled with fluorescence-tagged streptavidin on a biotinylated hyaluronan-binding protein, and confocal images were taken while the live cells were gradually permitted to reach room temperature. Three-dimensional z_-scans were taken every 5 min (total 90 min), and a movie was generated from the maximized images (see supplemental movie S10). Panels C and D,E and_F, and G and H are enlargements of regions marked by an arrow, pound sign, and asterisk, respectively, in_A_ and B. The left and right columns present images taken at time 0 and 90 min after exposure to room temperature, respectively (except for D, which represents an image at 70 min to better illustrate the membrane protrusion of the U937 cell). These images show plasma membrane projections from the U937 cells into a nearby hyaluronan matrix (D and F). Afterward, the hyaluronan matrix is no longer visible, implying degradation. Also, we observed regions in which part of the hyaluronan matrix appears to be reorganized and concentrated around the epithelial cell junctions (compare G and H).Magnification bars, 25 μm. This experiment was repeated more than six times.
Similar articles
- Primary murine airway smooth muscle cells exposed to poly(I,C) or tunicamycin synthesize a leukocyte-adhesive hyaluronan matrix.
Lauer ME, Mukhopadhyay D, Fulop C, de la Motte CA, Majors AK, Hascall VC. Lauer ME, et al. J Biol Chem. 2009 Feb 20;284(8):5299-312. doi: 10.1074/jbc.M807965200. Epub 2008 Dec 16. J Biol Chem. 2009. PMID: 19088077 Free PMC article. - Hyaluronan Rafts on Airway Epithelial Cells.
Abbadi A, Lauer M, Swaidani S, Wang A, Hascall V. Abbadi A, et al. J Biol Chem. 2016 Jan 15;291(3):1448-55. doi: 10.1074/jbc.M115.704288. Epub 2015 Nov 24. J Biol Chem. 2016. PMID: 26601955 Free PMC article. - Endoplasmic reticulum stress induces hyaluronan deposition and leukocyte adhesion.
Majors AK, Austin RC, de la Motte CA, Pyeritz RE, Hascall VC, Kessler SP, Sen G, Strong SA. Majors AK, et al. J Biol Chem. 2003 Nov 21;278(47):47223-31. doi: 10.1074/jbc.M304871200. Epub 2003 Sep 3. J Biol Chem. 2003. PMID: 12954638 - Hyaluronan-dependent pericellular matrix.
Evanko SP, Tammi MI, Tammi RH, Wight TN. Evanko SP, et al. Adv Drug Deliv Rev. 2007 Nov 10;59(13):1351-65. doi: 10.1016/j.addr.2007.08.008. Epub 2007 Aug 14. Adv Drug Deliv Rev. 2007. PMID: 17804111 Free PMC article. Review. - Hyaluronan matrices in pathobiological processes.
Wang A, de la Motte C, Lauer M, Hascall V. Wang A, et al. FEBS J. 2011 May;278(9):1412-8. doi: 10.1111/j.1742-4658.2011.08069.x. Epub 2011 Mar 25. FEBS J. 2011. PMID: 21362136 Free PMC article. Review.
Cited by
- The interplay between endoplasmic reticulum stress and inflammation.
Hasnain SZ, Lourie R, Das I, Chen AC, McGuckin MA. Hasnain SZ, et al. Immunol Cell Biol. 2012 Mar;90(3):260-70. doi: 10.1038/icb.2011.112. Epub 2012 Jan 17. Immunol Cell Biol. 2012. PMID: 22249202 Free PMC article. Review. - The Distinct Effects of Palmitic and Oleic Acid on Pancreatic Beta Cell Function: The Elucidation of Associated Mechanisms and Effector Molecules.
Nemecz M, Constantin A, Dumitrescu M, Alexandru N, Filippi A, Tanko G, Georgescu A. Nemecz M, et al. Front Pharmacol. 2019 Jan 21;9:1554. doi: 10.3389/fphar.2018.01554. eCollection 2018. Front Pharmacol. 2019. PMID: 30719005 Free PMC article. - The consequence of matrix dysfunction on lung immunity and the microbiome in COPD.
Hussell T, Lui S, Jagger C, Morgan D, Brand O. Hussell T, et al. Eur Respir Rev. 2018 Jun 27;27(148):180032. doi: 10.1183/16000617.0032-2018. Print 2018 Jun 30. Eur Respir Rev. 2018. PMID: 29950305 Free PMC article. - The inducible kinase IKKi is required for IL-17-dependent signaling associated with neutrophilia and pulmonary inflammation.
Bulek K, Liu C, Swaidani S, Wang L, Page RC, Gulen MF, Herjan T, Abbadi A, Qian W, Sun D, Lauer M, Hascall V, Misra S, Chance MR, Aronica M, Hamilton T, Li X. Bulek K, et al. Nat Immunol. 2011 Aug 7;12(9):844-52. doi: 10.1038/ni.2080. Nat Immunol. 2011. PMID: 21822257 Free PMC article. - Tumor necrosis factor-stimulated gene-6 (TSG-6) amplifies hyaluronan synthesis by airway smooth muscle cells.
Lauer ME, Cheng G, Swaidani S, Aronica MA, Weigel PH, Hascall VC. Lauer ME, et al. J Biol Chem. 2013 Jan 4;288(1):423-31. doi: 10.1074/jbc.M112.389882. Epub 2012 Nov 5. J Biol Chem. 2013. PMID: 23129777 Free PMC article.
References
- Laitinen, A., and Laitinen, L. A. (1994) Am. J. Respir. Crit. Care Med. 150 S14-S17 - PubMed
- McCarthy, K. J. (2008) Microsc. Res. Tech., 71 335-338 - PubMed
- Tammi, R. H., Tammi, M. I., Hascall, V. C., Hogg, M., Pasonen, S., and MacCallum, D. K. (2000) Histochem. Cell Biol. 113 265-277 - PubMed
- Weigel, P. H., Hascall, V. C., and Tammi, M. (1997) J. Biol. Chem. 272 13997-14000 - PubMed
- Tammi, R., Rilla, K., Pienimaki, J. P., MacCallum, D. K., Hogg, M., Luukkonen, M., Hascall, V. C., and Tammi, M. (2001) J. Biol. Chem. 276 35111-35122 - PubMed
Publication types
MeSH terms
Substances
LinkOut - more resources
Full Text Sources
Other Literature Sources
Miscellaneous
