Endosomal targeting of MEK2 requires RAF, MEK kinase activity and clathrin-dependent endocytosis - PubMed (original) (raw)
Endosomal targeting of MEK2 requires RAF, MEK kinase activity and clathrin-dependent endocytosis
Emilia Galperin et al. Traffic. 2008 Sep.
Abstract
To study spatiotemporal regulation of the mitogen-activated protein kinase (MAPK)/extracellular signal-regulated kinase (ERK1/2) signaling cascade in living cells, a HeLa cell line in which MAPK kinase of ERK kinase (MEK) 2 (MAPK kinase) was knocked down by RNA interference and replaced with the green fluorescent protein (GFP)-tagged MEK2 was generated. In these cells, MEK2-GFP was stably expressed at a level similar to that of the endogenous MEK2 in the parental cells. Upon activation of the EGF receptor (EGFR), a pool of MEK2-GFP was found initially translocated to the plasma membrane and then accumulated in a subset of early and late endosomes. However, activated MEK was detected only at the plasma membrane and not in endosomes. Surprisingly, MEK2-GFP endosomes did not contain active EGFR, suggesting that endosomal MEK2-GFP was separated from the upstream signaling complexes. Knockdown of clathrin by small interfering RNA (siRNA) abolished MEK2 recruitment to endosomes but resulted in increased activation of ERK without affecting the activity of MEK2-GFP. The accumulation of MEK2-GFP in endosomes was also blocked by siRNA depletion of RAF kinases and by the MEK1/2 inhibitor, UO126. We propose that the recruitment of MEK2 to endosomes can be a part of the negative feedback regulation of the EGFR-MAPK signaling pathway by endocytosis.
Figures
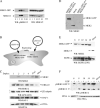
Figure 1. Replacement of MEK2 with MEK2–GFP in HeLa cells
A) HeLa cells transiently expressing MEK2–GFP were serum starved and treated with 50 ng/mL EGF for indicated times at 37°C. The lysates were probed for activated MEK1/2 (pMEK1/2) and total MEK1/2. B) Schematic representation of the KDAR method for generation of cell lines stably expressing MEK2–GFP (see Materials and Methods). N, nucleus. C) HeLa cells were transiently transfected with four individual siRNA duplexes or SMARTpool of these duplexes, lysed and MEK2 was detected in lysates by western blotting. Lysates were also probed for ERK1/2, β2-adaptin, RAF-1 and PP2A (loading control). D) HeLa cells were transiently transfected with MEK2–GFP resistant to siRNA duplex 3 (MEK2–GFP*) or wild-type MEK2–GFP (MEK2–GFP w/t) together with MEK2 siRNA duplex 3. Mock, transfection with nontargeting siRNA. MEK2 was detected in cell lysates using MEK2 antibodies. E) MEK2–GFP and endogenous MEK2 were detected in HeLa/MEK2–GFP clones and parental HeLa cells (HeLa) using MEK2 antibodies. EGFR was detected using antibodies 2193. F) Individual clones of HeLa/MEK2–GFP cells and parental HeLa cells (HeLa) were starved and then incubated without (–) or with 10 ng/mL EGF (+) for 5 min at 37°C. The lysates were probed for activated MEK1/2 (pMEK1/2) and PP2A (loading control).
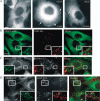
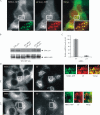
Figure 2. Localization of MEK2–GFP relative to EGF and EGFR – I
A) Serum-starved HeLa/MEK2–GFP (clone 6) cells were treated with EGF (10 ng/mL) for 3 and 10 min at 37°C. The living cells were imaged before and after EGF treatment. The arrows show examples of MEK2–GFP localization at the plasma membrane and in intracellular vesicles. B) Serum-starved HeLa/MEK2–GFP cells were treated with 10 ng/mL EGF–Rh for 10 min at 37°C and imaged using fluorescein isothiocyanate (for GFP) and Cy3 (for Rh) channels. C) Serum-starved HeLa/MEK2–GFP cells were treated with 10 ng/mL EGF, fixed, permeabilized and stained with the EGFR antibody 528. D) Serum-starved HeLa/MEK2–GFP cells were treated with 10 ng/mL EGF at 37°C, fixed, permeabilized and stained with the Grb2 antibody. Insets in (B–D) show high-magnification images of the regions of the cell indicated by white rectangles. Scale bars, 10 μm.
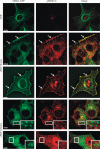
Figure 3. Localization of MEK2–GFP relative to EGF and EGFR – II
A) HeLa/MEK2–GFP cells were transfected with EGFR–mRFP and after 2 days, serum starved and treated with 10 ng/mL EGF–Alexa647 for 10 min at 37°C. Fluorescein isothiocyanate (FITC) (for GFP), Cy3 (for mRFP) and Cy5 (for Alexa647) filter channels were used for imaging of living cells. Insets show high-magnification images of the regions of the cell indicated by white rectangles. Scale bar, 10 μm. B) High-magnification images of the regions of the cell presented in (A) shown to highlight colocalization of MEK2–GFP with EGFR–mRFP (open arrowheads), EGFR–mRFP with EGF–Alexa647 (solid arrowheads) and absence of colocalization of EGF–Alexa647 and MEK2–GFP. C) Blowout of the peripheral region of the cell in (A) at the plane of the plasma membrane. Arrow points on the ruffle-like structure containing MEK2–GFP, EGFR–mRFP and EGF–Alexa647. D) Serum-starved HeLa/MEK2–GFP cells were incubated with 10 ng/mL EGF–Rh for 90 min at 20°C. Living cells were imaged using FITC (for GFP) and Cy3 (for Rh) channels. Insets show high-magnification images of the regions of the cell indicated by white rectangles. Arrows point on endosomes containing MEK2–GFP and EGF–Rh. Scale bar, 10 μm.
Figure 4. Localization of phosphorylated MEK in the plasma membrane but not in endosomes
Serum-starved HeLa/MEK2–GFP cells were untreated (–EGF) or treated with 10 ng/mL EGF for 5 and 10 min at 37°C and fixed. The cells were then processed for immunofluorescence staining with pMEK1/2 antibodies and secondary Cy3 donkey anti-rabbit antibodies. GFP and Cy3 were detected using fluorescein isothiocyanate and Cy3 filter channels. The examples of phosphorylated MEK2–GFP located at cell edges are shown by arrows. Insets represent high-magnification images of the regions of the cell indicated by white rectangles. Staining with pMEK1/2 antibodies often results in non-specific nuclear signal seen in untreated and EGF-treated cells. Therefore, two examples of cells treated with EGF with and without nuclear staining are shown. Scale bars, 10 μm.
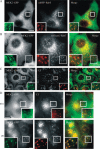
Figure 5. Characterization of endosomes containing MEK2–GFP
HeLa/MEK2–GFP cells were transfected with mRFP–Rab5 (A) or mCherry–Rab7 (B). Serum-starved cells were treated with EGF (10 ng/mL) for 10 min at 37°C. In (C), untransfected HeLa/MEK2–GFP cells were preloaded with 75 n
m
LysoTracker (LT) for 30 min and treated with EGF as in (A). In (D), clones 9 and 16 of HeLa/MEK2–GFP cells were preloaded with 75 n
m
LysoTracker for 30 min and treated with EGF as in (A). Living cells were imaged through fluorescein isothiocyanate and Cy3 filter channels. Insets show high-magnification images of the regions of the cell indicated by white rectangles. Scale bars, 10 μm.
Figure 6. Effect of p14 siRNA on MEK2–GFP recruitment to vesicles
A) HeLa/MEK2–GFP cells were transfected with mCherry–MP1, serum starved and treated with 10 ng/mL EGF for 10 min at 37°C. Cells were imaged through fluorescein isothiocyanate and Cy3 filter channels. Insets show high-magnification images of the regions of the cell indicated by white rectangles. Scale bar, 10 μm. B) HeLa/MEK2–GFP cells were cotransfected with p14–CFP plasmid and either nontargeting (NT) siRNA or duplex targeting p14. Total lysates were probed for p14–CFP and MEK2–GFP (loading control) using GFP antibodies. C) Total RNA was extracted from HeLa/MEK2–GFP cells transfected with either NT siRNA or siRNA duplex targeting p14 (p14), and quantitative RT-PCR was performed using specific p14 primers. The data are presented as per cent of p14 mRNA levels in cells transfected with NT siRNA (mean ± SD, n = 2). D) HeLa/MEK2–GFP cells were transfected with p14 or NT siRNA. Starved were pretreated 75 n
m
LysoTracker (LT) for 30 min and then with 10 ng/mL EGF for 10 min at 37°C. Images were acquired from living cells. Insets show high-magnification images of the regions of the cell indicated by white rectangles. Scale bar, 10 μm.
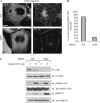
Figure 7. Effect of CHC siRNA on MEK2–GFP recruitment to endosomes
A) HeLa/MEK2–GFP cells were transfected with CHC or non-targeting (NT) siRNAs and serum starved. In (A), the cells were incubated with 2 ng/mL EGF and 5 μg/mL Tfr–TR for 10 min at 37°C and imaged through fluorescein isothiocyanate and Cy3 filter channels. Scale bar, 10 μm. B) Multiple images from the experiments exemplified in (A) were visually analyzed, and the percentage of cells containing MEK2–GFP endosomes was calculated (±SD). The data are representative of three independent experiments. C) The cells were treated with EGF as in (A) and lysed. The lysates were probed for CHC, α-actinin (loading control), pMEK1/2, total MEK1/2, pERK1/2 and total ERK1/2.
Figure 8. Effect of A-RAF/RAF-1 siRNA on MEK2–GFP recruitment to endosomes
A) HeLa/MEK2–GFP cells were transfected with siRNAs, A-RAF and RAF-1 (RAF-1/A) or nontargeting (NT) siRNA. Starved cells were treated with 10 ng/mL of EGF for 10 min at 37°C. Images were acquired from living cells. Scale bar, 10 μm. B) Multiple images from the experiments exemplified in (A) were visually analyzed, and the percentage of cells containing MEK2–GFP endosomes was calculated (±SD). The data are representative of six independent experiments. C) The cells were treated as in (A), lysed and the lysates were probed by western blotting with antibodies to pMEK1/2, MEK1/2, A-RAF and RAF-1. D) HeLa/MEK2–GFP cells were transfected with pBabe-puro empty vector (vector) or pBabe-puro encoding B-RAF mutant V600E [B-RAF(V600E)]. The cells were serum starved and lysed. The lysates were probed by western blotting with antibodies to pMEK1/2, MEK1/2, pERK1/2, B-RAF and α-actinin (loading control). E) Multiple images from the experiments described in (D) were analyzed, and the percentage of cells containing MEK2–GFP endosomes was calculated (±SD). The data are representative of two independent experiments.
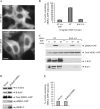
Figure 9. Effect of UO126 on MEK2–GFP recruitment to endosomes
A) Serum-starved HeLa and HeLa/MEK2–GFP cells were treated with UO126 or dimethyl sulfoxide (DMSO) (vehicle) for 2 h at 37°C. The cells were then incubated with 10 ng/mL of EGF at 37°C, lysed and the activated ERK1/2 proteins were detected by western blot using pERK1/2 antibodies. B) Serum-starved HeLa/MEK2–GFP cells were treated with UO126 or DMSO and then with EGF as in (A). Images were acquired from living cells. Scale bar, 10 μm. C) Multiple images from the experiments exemplified in (B) were visually analyzed, and the percentage of cells containing MEK2–GFP endosomes was calculated (±SD). The data are representative of four independent experiments.
Similar articles
- Shoc2 is targeted to late endosomes and required for Erk1/2 activation in EGF-stimulated cells.
Galperin E, Abdelmoti L, Sorkin A. Galperin E, et al. PLoS One. 2012;7(5):e36469. doi: 10.1371/journal.pone.0036469. Epub 2012 May 14. PLoS One. 2012. PMID: 22606262 Free PMC article. - Imaging the Raf-MEK-ERK Signaling Cascade in Living Cells.
Shin YC, Cho M, Hwang JM, Myung K, Kweon HS, Lee ZW, Seong HA, Lee KB. Shin YC, et al. Int J Mol Sci. 2024 Oct 1;25(19):10587. doi: 10.3390/ijms251910587. Int J Mol Sci. 2024. PMID: 39408915 Free PMC article. - ERK1/2 can feedback-regulate cellular MEK1/2 levels.
Hong SK, Wu PK, Karkhanis M, Park JI. Hong SK, et al. Cell Signal. 2015 Oct;27(10):1939-48. doi: 10.1016/j.cellsig.2015.07.003. Epub 2015 Jul 9. Cell Signal. 2015. PMID: 26163823 Free PMC article. - Role of lipids in the MAPK signaling pathway.
Anderson DH. Anderson DH. Prog Lipid Res. 2006 Mar;45(2):102-19. doi: 10.1016/j.plipres.2005.12.003. Epub 2006 Jan 18. Prog Lipid Res. 2006. PMID: 16455141 Review. - MEK1 and MEK2 inhibitors and cancer therapy: the long and winding road.
Caunt CJ, Sale MJ, Smith PD, Cook SJ. Caunt CJ, et al. Nat Rev Cancer. 2015 Oct;15(10):577-92. doi: 10.1038/nrc4000. Nat Rev Cancer. 2015. PMID: 26399658 Review.
Cited by
- Selective regulation of MAP kinase signaling by an endomembrane phosphatidylinositol 4-kinase.
Cappell SD, Dohlman HG. Cappell SD, et al. J Biol Chem. 2011 Apr 29;286(17):14852-60. doi: 10.1074/jbc.M110.195073. Epub 2011 Mar 9. J Biol Chem. 2011. PMID: 21388955 Free PMC article. - Small molecule induced oligomerization, clustering and clathrin-independent endocytosis of the dopamine transporter.
Sorkina T, Ma S, Larsen MB, Watkins SC, Sorkin A. Sorkina T, et al. Elife. 2018 Apr 9;7:e32293. doi: 10.7554/eLife.32293. Elife. 2018. PMID: 29630493 Free PMC article. - Feedback control of ErbB2 via ERK-mediated phosphorylation of a conserved threonine in the juxtamembrane domain.
Kawasaki Y, Sakimura A, Park CM, Tomaru R, Tanaka T, Ozawa T, Zhou Y, Narita K, Kishi H, Muraguchi A, Sakurai H. Kawasaki Y, et al. Sci Rep. 2016 Aug 17;6:31502. doi: 10.1038/srep31502. Sci Rep. 2016. PMID: 27531070 Free PMC article. - Atypical p38 Signaling, Activation, and Implications for Disease.
Burton JC, Antoniades W, Okalova J, Roos MM, Grimsey NJ. Burton JC, et al. Int J Mol Sci. 2021 Apr 17;22(8):4183. doi: 10.3390/ijms22084183. Int J Mol Sci. 2021. PMID: 33920735 Free PMC article. Review. - Suppression of EGFR endocytosis by dynamin depletion reveals that EGFR signaling occurs primarily at the plasma membrane.
Sousa LP, Lax I, Shen H, Ferguson SM, De Camilli P, Schlessinger J. Sousa LP, et al. Proc Natl Acad Sci U S A. 2012 Mar 20;109(12):4419-24. doi: 10.1073/pnas.1200164109. Epub 2012 Feb 27. Proc Natl Acad Sci U S A. 2012. PMID: 22371560 Free PMC article.
References
- Schlessinger J. Cell signaling by receptor tyrosine kinases. Cell. 2000;103:211–225. - PubMed
- Rozakis-Adcock M, Fernley R, Wade J, Pawson T, Bowtell D. The SH2 and SH3 domains of mammalian Grb2 couple the EGF receptor to the Ras activator mSos1. Nature. 1993;363:83–85. - PubMed
- Cobb MH. MAP kinase pathways. Prog Biophys Mol Biol. 1999;71:479–500. - PubMed
- Pearson G, Robinson F, Beers Gibson T, Xu BE, Karandikar M, Berman K, Cobb MH. Mitogen-activated protein (MAP) kinase pathways: regulation and physiological functions. Endocr Rev. 2001;22:153–183. - PubMed
Publication types
MeSH terms
Substances
Grants and funding
- P20 RR020171/RR/NCRR NIH HHS/United States
- K99 CA126161/CA/NCI NIH HHS/United States
- R01 CA089151/CA/NCI NIH HHS/United States
- K99 CA126161-01A2/CA/NCI NIH HHS/United States
- R29 DK046817-06S1/DK/NIDDK NIH HHS/United States
- R01 GM059570/GM/NIGMS NIH HHS/United States
- GM059570/GM/NIGMS NIH HHS/United States
- CA089151-08/CA/NCI NIH HHS/United States
LinkOut - more resources
Full Text Sources
Research Materials
Miscellaneous
