Interferon-gamma, a Th1 cytokine, regulates fat inflammation: a role for adaptive immunity in obesity - PubMed (original) (raw)
Interferon-gamma, a Th1 cytokine, regulates fat inflammation: a role for adaptive immunity in obesity
Viviane Zorzanelli Rocha et al. Circ Res. 2008.
Abstract
Adipose tissue (AT) can accumulate macrophages and secrete several inflammatory mediators. Despite its pivotal role in the progression of chronic inflammatory processes such as atherosclerosis, the adaptive role of immunity in obesity remains poorly explored. Visceral AT of diet-induced obese C57BL/6 mice had higher numbers of both CD4(+) and CD8(+) T cells than lean controls, monitored by flow cytometry. When stimulated in vitro, T cells from obese AT produced more interferon (IFN)gamma than those from controls. AT from obese animals also had more cells expressing I-A(b), a mouse class II histocompatibility marker implicated in antigen presentation, as determined by immunostaining. Differentiated 3T3-L1 cells stimulated with recombinant IFNgamma or T-helper 1-derived supernatant produced several chemokines and their mRNAs. Obese IFNgamma-deficient animals had significantly reduced AT expression of mRNA-encoding inflammatory genes such as tumor necrosis factor-alpha and monocyte chemoattractant protein-1, decreased AT inflammatory cell accumulation, and better glucose tolerance than control animals consuming the same diet. Obese mice doubly deficient for IFNgamma receptor and apolipoprotein (Apo)E on a mixed 129SvEv/C57BL/6 (129/B6) genetic background, despite exhibiting similar AT mRNA levels of tumor necrosis factor-alpha and monocyte chemoattractant protein-1 as 129/B6-ApoE(-/-) controls, had decreased expression of important T cell-related genes, such as IFNgamma-inducible protein-10 and I-A(b), and lower plasma triglycerides and glucose. These results indicate a role for T cells and IFNgamma, a prototypical T-helper 1 cytokine, in regulation of the inflammatory response that accompanies obesity.
Figures
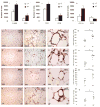
Figure 1. Visceral AT from obese mice contains more inflammatory cells than that from lean controls
SVCs from peri-epididymal AT from lean and obese C57BL/6J animals were labeled with conjugated antibodies to F4/80, CD3 (I), CD4, CD8 (II), CD11c, and B220 (III), and quantified by flow cytometry. The graphs represent differences between mice on LF (lean) and HF (obese) diets, calculated by Student’s t-test. *p<0.05 vs LF. Immunostaining of peri-epididymal fat tissue with rat anti-mouse CD45 (A–C), Mac-3 (E–G), CD3 (I–L), and I-Ab (N-P) antibodies was performed as described. Graphs (D, H, M, Q) represent the numbers of positive cells in each group, and the differences were calculated by Student’s t-test. Original magnification: x100 for A–B, E–F, I–J, N–O; x400 for C, G, L, and P. #p<0.05 vs LF; n=5–8.
Figure 2. IFNγ expression in AT increases with diet-induced obesity in mice
RNA was extracted from visceral AT from C57BL/6J mice on LF or HF diet for 21 weeks. RT-qPCR measured mRNA levels of IFNγ over GAPDH in both groups (n=10 in each) (2A). SVCs isolated from AT from C57BL/6J mice fed a LF or HF diet for 15 weeks were labeled with CD3 and IFNγ antibodies after incubation with (2B, right) or without (2B, left) PMA and ionomycin. The graph (2C) represents the difference of IFNγ production by T cells and other cells between lean and obese groups, calculated by Student’s t-test. *p<0.05 vs LF.
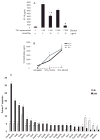
Figure 3. IFNγ stimulates the expression of chemokines in 3T3-L1 cells
In 3A, 3T3-L1 cells were incubated with different dilutions of conditioned media from Th1 cells, with or without 10 μg/ml of anti-IFNγ. Levels of IP-10 were measured in the supernatants. Differences were calculated in pairs by Student’s t-test. *p<0.05 vs control (Th1 0/anti-IFNγ 0); #p<0.05 vs preceding bar. In 3B, 3T3-L1 cells were stimulated with different concentrations of mouse recombinant IFNγ. MCP-1, IP-10, and MIG protein levels were measured in the supernatants. In 3C, 3T3-L1 cells were stimulated with 100 U/ml of IFNγ or left untreated. After 4 and 24 h, cells were harvested and mRNA was used in a microarray screening. The white bars represent the T statistic values after 4 h and the black bars, after 24 h of stimulation with IFNγ, relative to expression in untreated cells; n=5–6; *p<0.05 vs untreated.
Figure 4. IFNγ induces expression of cytokines by AT in culture
Minced peri-epididymal AT was incubated with media alone or with 100U/ml of IFNγ for 6 h at 37°C and protein levels of IP-10, MIG and TNFα (A–C) were measured; n=3; *p≤0.01 vs untreated AT, calculated by Student’s t-test.
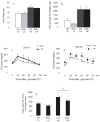
Figure 5. IFNγ deficiency does not change total body weight, but improves glucose tolerance (GT) in obese mice
5A–B: the bars represent average numbers of each group, and differences were calculated by Student’s t-test. In 5C, average GT curves from both groups under LF diet and in 5D, from groups under HF diet. Area under the GT curve was calculated for each mouse and the average of each group represented in 5E. Differences between groups were calculated by Student’s t-test. *p≤0.05 vs WT/LF; #p≤0.05.; n=5–6.
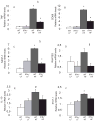
Figure 6. IFNγ regulates inflammatory gene expression in visceral fat of obese mice
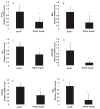
mRNA levels of TNFα, CD68, MCP-1, RANTES, IL-10, and STAT-1 (A–F, respectively) in peri-epididymal AT were quantified by RT-qPCR and normalized to GAPDH. Fold change was calculated relative to WT/LF. *p<0.01 vs WT/LF; #p<0.05 vs WT/LF; §p<0.05; n=5–6.
Figure 7. IFNγ deficiency limits inflammatory cell accumulation in obese visceral AT
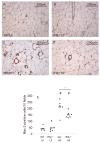
Fixed and paraffin-embedded AT was stained with anti-Mac-3 antibody, and positive cells were counted in 10 consecutive fields in each slide. A representative picture from each group is shown (7A–D). Numbers from each group were plotted in 7E. Differences were calculated by Student’s t-test. #p<0.05 vs WT/LF; *p<0.05; n=5–6..
Figure 8. IFNγ deficiency regulates inflammation in visceral fat of obese ApoE −/− mice
mRNA levels of IP-10, MIG, I-Ab, RANTES, CXCR3, and CD3 (A–F) in peri-epididymal AT were quantified by RT-qPCR and normalized to GAPDH. Fold change was calculated relative to ApoE−/−. *p<0.05 vs ApoE−/− **p<0.01 vs ApoE−/−; n=5–8.
Similar articles
- Attenuated adipose tissue and skeletal muscle inflammation in obese mice with combined CD4+ and CD8+ T cell deficiency.
Khan IM, Dai Perrard XY, Perrard JL, Mansoori A, Wayne Smith C, Wu H, Ballantyne CM. Khan IM, et al. Atherosclerosis. 2014 Apr;233(2):419-428. doi: 10.1016/j.atherosclerosis.2014.01.011. Epub 2014 Jan 21. Atherosclerosis. 2014. PMID: 24530773 Free PMC article. - Regulation of adipose tissue T cell subsets by Stat3 is crucial for diet-induced obesity and insulin resistance.
Priceman SJ, Kujawski M, Shen S, Cherryholmes GA, Lee H, Zhang C, Kruper L, Mortimer J, Jove R, Riggs AD, Yu H. Priceman SJ, et al. Proc Natl Acad Sci U S A. 2013 Aug 6;110(32):13079-84. doi: 10.1073/pnas.1311557110. Epub 2013 Jul 22. Proc Natl Acad Sci U S A. 2013. PMID: 23878227 Free PMC article. - Systemic inflammation and insulin sensitivity in obese IFN-γ knockout mice.
O'Rourke RW, White AE, Metcalf MD, Winters BR, Diggs BS, Zhu X, Marks DL. O'Rourke RW, et al. Metabolism. 2012 Aug;61(8):1152-61. doi: 10.1016/j.metabol.2012.01.018. Epub 2012 Mar 3. Metabolism. 2012. PMID: 22386937 Free PMC article. - The "Big Bang" in obese fat: Events initiating obesity-induced adipose tissue inflammation.
Wensveen FM, Valentić S, Šestan M, Turk Wensveen T, Polić B. Wensveen FM, et al. Eur J Immunol. 2015 Sep;45(9):2446-56. doi: 10.1002/eji.201545502. Epub 2015 Aug 19. Eur J Immunol. 2015. PMID: 26220361 Review. - White adipose tissue dysfunction in obesity and aging.
Reyes-Farias M, Fos-Domenech J, Serra D, Herrero L, Sánchez-Infantes D. Reyes-Farias M, et al. Biochem Pharmacol. 2021 Oct;192:114723. doi: 10.1016/j.bcp.2021.114723. Epub 2021 Aug 5. Biochem Pharmacol. 2021. PMID: 34364887 Review.
Cited by
- Regulation of adipogenic differentiation and adipose tissue inflammation by interferon regulatory factor 3.
Tang P, Virtue S, Goie JYG, Png CW, Guo J, Li Y, Jiao H, Chua YL, Campbell M, Moreno-Navarrete JM, Shabbir A, Fernández-Real JM, Gasser S, Kemeny DM, Yang H, Vidal-Puig A, Zhang Y. Tang P, et al. Cell Death Differ. 2021 Nov;28(11):3022-3035. doi: 10.1038/s41418-021-00798-9. Epub 2021 Jun 5. Cell Death Differ. 2021. PMID: 34091599 Free PMC article. - Class II transactivator (CIITA) mediates transcriptional repression of pdk4 gene by interacting with hypermethylated in cancer 1 (HIC1).
Fang M, Li P, Wu X, Xu Y. Fang M, et al. J Biomed Res. 2015 Jul;29(4):308-15. doi: 10.7555/JBR.29.20150055. Epub 2015 Jun 30. J Biomed Res. 2015. PMID: 26243517 Free PMC article. - Class II major histocompatibility complex plays an essential role in obesity-induced adipose inflammation.
Deng T, Lyon CJ, Minze LJ, Lin J, Zou J, Liu JZ, Ren Y, Yin Z, Hamilton DJ, Reardon PR, Sherman V, Wang HY, Phillips KJ, Webb P, Wong ST, Wang RF, Hsueh WA. Deng T, et al. Cell Metab. 2013 Mar 5;17(3):411-22. doi: 10.1016/j.cmet.2013.02.009. Cell Metab. 2013. PMID: 23473035 Free PMC article. - Obesity-induced inflammation and insulin resistance: A mini-review on T-cells.
Nyambuya TM, Dludla PV, Mxinwa V, Nkambule BB. Nyambuya TM, et al. Metabol Open. 2019 Aug 10;3:100015. doi: 10.1016/j.metop.2019.100015. eCollection 2019 Sep. Metabol Open. 2019. PMID: 32812921 Free PMC article. - Inhibiting LXRα phosphorylation in hematopoietic cells reduces inflammation and attenuates atherosclerosis and obesity in mice.
Voisin M, Shrestha E, Rollet C, Nikain CA, Josefs T, Mahé M, Barrett TJ, Chang HR, Ruoff R, Schneider JA, Garabedian ML, Zoumadakis C, Yun C, Badwan B, Brown EJ, Mar AC, Schneider RJ, Goldberg IJ, Pineda-Torra I, Fisher EA, Garabedian MJ. Voisin M, et al. Commun Biol. 2021 Mar 26;4(1):420. doi: 10.1038/s42003-021-01925-5. Commun Biol. 2021. PMID: 33772096 Free PMC article.
References
- Ogden CL, Yanovski SZ, Carroll MD, Flegal KM. The epidemiology of obesity. Gastroenterology. 2007;132:2087–2102. - PubMed
- Ogden CL, Carroll MD, Curtin LR, McDowell MA, Tabak CJ, Flegal KM. Prevalence of overweight and obesity in the United States, 1999–2004. Jama. 2006;295:1549–1555. - PubMed
- Hedley AA, Ogden CL, Johnson CL, Carroll MD, Curtin LR, Flegal KM. Prevalence of overweight and obesity among US children, adolescents, and adults, 1999–2002. Jama. 2004;291:2847–2850. - PubMed
- Van Gaal LF, Mertens IL, De Block CE. Mechanisms linking obesity with cardiovascular disease. Nature. 2006;444:875–880. - PubMed
Publication types
MeSH terms
Substances
Grants and funding
- R01 HL034636/HL/NHLBI NIH HHS/United States
- R01 HL034636-20/HL/NHLBI NIH HHS/United States
- R37 HL034636/HL/NHLBI NIH HHS/United States
- HL-34636/HL/NHLBI NIH HHS/United States
LinkOut - more resources
Full Text Sources
Other Literature Sources
Medical
Molecular Biology Databases
Research Materials
Miscellaneous
