The BTB-zinc finger transcriptional regulator PLZF controls the development of invariant natural killer T cell effector functions - PubMed (original) (raw)
doi: 10.1038/ni.1641. Epub 2008 Jul 27.
Olisambu U Uche, Sonia Eladad, Robin M Hobbs, Woelsung Yi, Eric Alonzo, Kevin Chua, Maggie Eidson, Hye-Jung Kim, Jin S Im, Pier Paolo Pandolfi, Derek B Sant'Angelo
Affiliations
- PMID: 18660811
- PMCID: PMC2662733
- DOI: 10.1038/ni.1641
The BTB-zinc finger transcriptional regulator PLZF controls the development of invariant natural killer T cell effector functions
Damian Kovalovsky et al. Nat Immunol. 2008 Sep.
Abstract
Invariant natural killer T cells (iNKT cells) have an innate immunity-like rapidity of response and the ability to modulate the effector functions of other cells. We show here that iNKT cells specifically expressed the BTB-zinc finger transcriptional regulator PLZF. In the absence of PLZF, iNKT cells developed, but they lacked many features of innate T cells. PLZF-deficient iNKT cells accumulated in lymph nodes rather than in the liver, did not express NK markers and did not have the characteristic activated phenotype. PLZF-deficient iNKT cells failed to secrete large amounts of interleukin 4 and interferon-gamma after activation; however, some cells produced either interleukin 4 or interferon-gamma but not both. PLZF, therefore, is an iNKT cell-specific transcription factor that is necessary for full functionality.
Figures
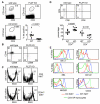
Fig. 1. PLZF is highly expressed in iNKT cells
(A) Relative PLZF mRNA expression measured by quantitative real time PCR of cDNA derived from CD1d tetramer positive iNKT cells and tetramer negative conventional T cells isolated by cell sorting from the thymus and the liver. HPRT cDNA levels were used to normalize samples. Average of two experiments is shown with standard deviations. (B) FACS analysis of thymocytes and percol gradient enriched, liver lymphocytes. iNKT cells were detected with the CD1d:α-GalCer tetramer and anti-CD3. Histograms show PLZF expression in permeabilized iNKT cells gated as shown in dot plots. Specificity of the anti-PLZF antibody was confirmed by staining T cells and iNKT cells from PLZF deficient mice. Data are representative of more than ten experiments. (C) Peripheral blood was collected from healthy human volunteers. Lymphocytes were isolated by ficoll separation and stained with the indicated antibodies. FACS was repeated on five different individuals with similar results. Thymocytes from (D) wild type and (E) T-bet deficient mice were stained with antibodies against CD44, NK1.1, PLZF and the CD1d tetramer. Only tetramer positive cells are shown. The stage of development is indicated (stage 1 – 3) on the two-color dot plot. PLZF levels within a particular stage of development are shown in the histogram to the right. T-bet deficient iNKT cells do not mature to stage 3. Data from one of two similar experiments is shown. (F) The thymuses from pooled 10-13 day old wild type mice were depleted of CD8 positive cells and then stained with the antibodies against CD3, HSA, CD44, NK1.1, PLZF and the CD1d tetramer. Staining of the same cell preparations with empty tetramer confirmed specificity. Empty tetramer labeled with a different fluorochrome was also used in some experiments to further eliminate non-specific events. For FACS analysis, single cell suspensions were first incubated with normal mouse serum, unlabeled streptavidin and anti-FC receptor blocking antibody. Cells were stained with antibody and tetramer on ice, permeabilized with the eBioscience intracellular staining buffer set followed by staining with the anti-PLZF monoclonal antibody. Lines in histograms are matched to the color of the gates in the dot plots. The black, dotted line shows CD4 single positive thymocytes, which do not express PLZF.
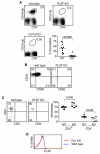
Fig. 2. PLZF expression is limited to iNKT cells and does not affect the bulk of lymphocyte development
(A) Intracellular staining for PLZF expression in B cells and NK cells was done and compared to the same cell types from PLZF deficient mice. Expression of PLZF in iNKT cells is shown as a positive control. (B) Single cell suspensions of thymus and lymph node cells were stained with the indicated monoclonal antibodies. The percentage and phenotype of the major subpopulations of thymocytes and lymphocytes were similar in wild type and PLZF deficient mice, based on staining with CD4, CD8 and TCR. Subtle variations in thymocyte numbers were not reproducible. Only TCR+ lymph node cells are shown. Experiment was repeated approximately 10 times. (C) Frozen thymus sections were stained with Dec205 and with UEA-1 to identify the thymic cortex and medulla. No structural changes to the organ were observed. (D) The frequency of NK cells, DX5+ T cells, and γδ T cells is not affected by the loss of PLZF expression. Data are representative of three independent experiments.
Fig. 3. Altered iNKT cell development in PLZF deficient mice
Thymocytes from the indicated mouse lines were stained with CD1d:α-GalCer tetramers and antibodies against CD3, CD44, CD69, CD4 and CD8. (A) PLZF deficient mice have an approximately 9-fold decrease in the number of iNKT cells. Numbers indicate the percentage of cells within the gate. The frequency of iNKT cells in 13 wild type and 14 PLZF deficient mice is shown in the scatter plot. Analysis was done by determining the percentage of tetramer positive cells among the CD3hi thymocytes. Percentages were used rather than absolute numbers to normalize for differences in the total cellularity of the thymus due to the age or sex of the mice. P values are indicated in the figure. (B) iNKT cells from PLZF deficient mice do not upregulate CD44. Both WT and KO iNKT cells upregulate CD69. (C) BrdU incorporation into iNKT cells in the thymus 16-hours after injection into 10-13 day old mice. Both total iNKT cells and only CD44lo iNKT cells are shown. Experiment was repeated twice. (D) iNKT cells from PLZF deficient mice are skewed towards CD4+. Only iNKT cells are shown in the FACS plot. Numbers indicate the percentage of cells in the region. The increase in the percentage of CD4+ iNKT cells and the corresponding decrease in the percentage of CD4− iNKTs in the in PLZF deficient mice in 8 wild type and 9 PLZF deficient mice are shown as a scatter plots. Data set comparisons and P values are indicated in the figure. (E) PLZF deficient iNKT cells have reduced expression of many cell surface markers typical of iNKT cells such as NK1.1, DX5, NKG2D, 2B4 (CD244) and CD122. Change in expression of each marker was confirmed in at least three independent experiments. P values were derived from two-tailed, unpaired Student's t-test. Choices of statistical tests are explained in the methods section.
Fig. 4. Reduced frequency and altered phenotype of liver iNKT cells in PLZF deficient mice
(A) Percoll enriched liver lymphocytes were stained and analyzed as above. PLZF deficient mice had approximately 40-fold fewer iNKT cells. The percentage of iNKT cells among CD3+ cells was used to compare 10 WT and 10 KO mice. Percentages were used rather than absolute numbers to correct for differences in extraction of lymphocytes and potential variations of other cell populations. The P values are indicated in the figure. (B) PLZF deficient liver iNKT cells were mostly CD44lo and CD69lo as compared to wild type iNKT cells. (C) As in the thymus, PLZF deficient iNKT cells are skewed towards expressing CD4. Data from 5 WT and 5 KO mice are shown in the scatter plot along with P values. (D) Liver iNKT cells harvested from older (∼6 months) Fyn deficient mice expressed wild type levels of PLZF. This finding was confirmed in three independent experiments. P values were derived from two-tailed, unpaired Student's t-test. Choices of statistical tests are explained in the methods section.
Fig. 5. PLZF deficient iNKTs accumulate in the lymph nodes and spleen
Lymph node (axillary, brachial, inguinal and mesenteric) and spleen cells from the indicated mouse lines were stained with CD1d:α-GalCer tetramers and antibodies against CD3, CD44, CD69, CD4 and CD8. (A) PLZF deficient mice have approximately 2-fold more lymph node iNKT cells and approximately 5-fold fewer spleen iNKT cells. Numbers indicate the percentage of cells within the gate. The frequency of iNKT cells among lymph node cells from 6 wild type and 8 PLZF deficient mice and spleen cells from 8 wild type and 10 PLZF deficient mice are shown in the scatter plots. Analysis was done by determining the percentage of tetramer positive cells among the total CD3+ T cells. Percentages were used rather than absolute numbers to normalize for differences in the total cellularity of the tissues due to the age of the mice. Cellularity of the lymph nodes and the spleens from age matched WT and PLZF KO mice were, however, nearly identical. Data set comparisons and P values are indicated in the figure. (B) iNKT cells from the lymph nodes and spleens of PLZF deficient mice do not upregulate CD44 and tend to be CD69lo. Data is representative of at least five independent experiments. (C) Lymph node PLZF deficient iNKT cells are skewed towards expressing CD4. The increase in the percentage of CD4+ iNKT cells and the corresponding decrease in the percentage of CD4− iNKTs in the lymph nodes and spleens from wild type and PLZF deficient mice are shown in the scatter plots. P values are shown in the figure. (D) PLZF deficient iNKT cells have markedly reduced expression of several markers typically found on wild type iNKT cells from the spleen. P values were derived from two-tailed, unpaired Student's t-test. Choices of statistical tests are explained in the methods section.
Fig. 6. PLZF deficient iNKT cells do not rapidly produce cytokines
(A) Mice (wild type, PLZF deficient, CD1d deficient) were I.P. immunized with 4 gof α-GalCer. Six hours later the spleen was removed, dissociated and stained with the indicated antibodies. Activation of the indicated cell type was measured by upregulation of CD69. (B) Sera were collected from the immunized mice six hours after immunization, diluted 10-fold and ELISAs were done to detect the cytokines IL-4, IFNγ and IL-2. These cytokines were not detected (n.d.) in the PLZF deficient mice or in the CD1d deficient mice. Experiments were done with three animals per group and were repeated twice with nearly identical results. ELISA data represent the means, with standard deviations for the two independent experiments.
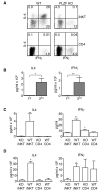
Fig. 7. PLZF deficient iNKT present an altered cytokine secretion pattern
(A) Cells were collected by cell sorting and then activated with 50 ng/ml PMA and 500 ng/ml ionomycin for a total of five hours. Brefeldin A was added for the last four hours of the incubation. Cells were then fixed and permeabilized with BD's perm/fix reagents. Permeabilized cells were then stained with antibodies against IL-4 and IFNγ. (B) Single cell suspensions of combined lymph node and spleen cells were depleted of CD8 and MHC class II expressing cells and then stained with the CD1d tetramer and an antibody against TCR Cβ. Tetramer+,TCR Cβ+ cells then were collected by FACS. Approximately 1×10⁴ of each T cell type was activated with 5 μg/ml plate bound anti-CD3 and 5 μg/ml soluble anti-CD28 in the presence of IL-2 and IL-15. Supernatants from the primary activation were collected after 24 hours. Cells were then fed with fresh media containing IL-2 and IL-15. After a total of five days, supernatant was removed and discarded. The cells, in fresh media, were reactivated with plate bound anti-CD3 and soluble anti-CD28. Supernatants were again collected after 24 hours. Supernatants were analyzed for the presence of IL-4 and IFNγ by the use of BD Biosciences Cytokine Bead Arrays. Supernatants were collected and analyzed as described above from sorted T cells that were (C) activated and then (D) reactivated as described above. Each T cell type was set up in duplicate or triplicate depending upon the number of cells collected. Repeats from each experiment were averaged. A total of five independent experiments were done. Means and standard deviations for the five experiments are shown. The value for the PLZF deficient iNKTs (KO iNKT) was compared to the other three cell types. P values are marked as * <0.05; ** <0.005. P values were derived using a two-tailed, unparied Mann-Whitney U-test. Choices of statistical tests are explained in the methods section.
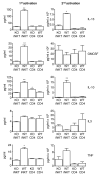
Fig. 8. Expression of Multiple cytokines are affected by the loss of PLZF expression
Supernatants generated and collected as for Fig. 7 were analyzed for TNF, IL-13, GMCSF, IL-3, and IL-10 by BD Biosciences Cytokine Bead Arrays. Supernatants were also tested for IL-5, IL-9 and IL-12p70, but these cytokines were not detected under these conditions. Five independent experiments were done. Triplicates from each experiment were averaged and considered as a single data point. Means and standard deviations for the five experiments are shown. The value for the PLZF deficient iNKTs (KO iNKT) was compared to the other three cell types. P values are marked as * <0.05; ** <0.005. P values were derived using a two-tailed, unparied Mann-Whitney U-test. Choices of statistical tests are explained in the methods section.
Comment in
- The making of NKT cells.
Gapin L. Gapin L. Nat Immunol. 2008 Sep;9(9):1009-11. doi: 10.1038/ni0908-1009. Nat Immunol. 2008. PMID: 18711440 Free PMC article.
Similar articles
- Development of promyelocytic zinc finger and ThPOK-expressing innate gamma delta T cells is controlled by strength of TCR signaling and Id3.
Alonzo ES, Gottschalk RA, Das J, Egawa T, Hobbs RM, Pandolfi PP, Pereira P, Nichols KE, Koretzky GA, Jordan MS, Sant'Angelo DB. Alonzo ES, et al. J Immunol. 2010 Feb 1;184(3):1268-79. doi: 10.4049/jimmunol.0903218. Epub 2009 Dec 28. J Immunol. 2010. PMID: 20038637 Free PMC article. - Promyelocytic leukemia zinc finger controls type 2 immune responses in the lungs by regulating lineage commitment and the function of innate and adaptive immune cells.
Sha J, Zhang M, Feng J, Shi T, Li N, Jie Z. Sha J, et al. Int Immunopharmacol. 2024 Mar 30;130:111670. doi: 10.1016/j.intimp.2024.111670. Epub 2024 Feb 18. Int Immunopharmacol. 2024. PMID: 38373386 Review. - Regulatory iNKT cells lack expression of the transcription factor PLZF and control the homeostasis of T(reg) cells and macrophages in adipose tissue.
Lynch L, Michelet X, Zhang S, Brennan PJ, Moseman A, Lester C, Besra G, Vomhof-Dekrey EE, Tighe M, Koay HF, Godfrey DI, Leadbetter EA, Sant'Angelo DB, von Andrian U, Brenner MB. Lynch L, et al. Nat Immunol. 2015 Jan;16(1):85-95. doi: 10.1038/ni.3047. Epub 2014 Dec 1. Nat Immunol. 2015. PMID: 25436972 Free PMC article. - Mammalian target of rapamycin complex 2 regulates invariant NKT cell development and function independent of promyelocytic leukemia zinc-finger.
Prevot N, Pyaram K, Bischoff E, Sen JM, Powell JD, Chang CH. Prevot N, et al. J Immunol. 2015 Jan 1;194(1):223-30. doi: 10.4049/jimmunol.1401985. Epub 2014 Nov 17. J Immunol. 2015. PMID: 25404366 Free PMC article. - Development of PLZF-expressing innate T cells.
Alonzo ES, Sant'Angelo DB. Alonzo ES, et al. Curr Opin Immunol. 2011 Apr;23(2):220-7. doi: 10.1016/j.coi.2010.12.016. Epub 2011 Jan 21. Curr Opin Immunol. 2011. PMID: 21257299 Free PMC article. Review.
Cited by
- Eed-dependent histone modification orchestrates the iNKT cell developmental program alleviating liver injury.
Guo Y, Ohki S, Kawano Y, Kong WS, Ohno Y, Honda H, Kanno M, Yasuda T. Guo Y, et al. Front Immunol. 2024 Sep 20;15:1467774. doi: 10.3389/fimmu.2024.1467774. eCollection 2024. Front Immunol. 2024. PMID: 39372408 Free PMC article. - TET proteins regulate Drosha expression and impact microRNAs in iNKT cells.
Gioulbasani M, Äijö T, Valenzuela JE, Bettes JB, Tsagaratou A. Gioulbasani M, et al. Front Immunol. 2024 Sep 19;15:1440044. doi: 10.3389/fimmu.2024.1440044. eCollection 2024. Front Immunol. 2024. PMID: 39364402 Free PMC article. - Thymic development of human natural killer T cells: recent advances and implications for immunotherapy.
Pellicci DG, Tavakolinia N, Perriman L, Berzins SP, Menne C. Pellicci DG, et al. Front Immunol. 2024 Aug 29;15:1441634. doi: 10.3389/fimmu.2024.1441634. eCollection 2024. Front Immunol. 2024. PMID: 39267746 Free PMC article. Review. - TET proteins regulate Drosha expression and impact microRNAs in iNKT cells.
Gioulbasani M, Äijö T, Valenzuela JE, Bettes JB, Tsagaratou A. Gioulbasani M, et al. bioRxiv [Preprint]. 2024 Jul 31:2024.07.31.605991. doi: 10.1101/2024.07.31.605991. bioRxiv. 2024. PMID: 39131272 Free PMC article. Updated. Preprint. - Key Functions of the Transcription Factor BCL6 During T-Cell Differentiation.
Konstantakopoulou C, Verykokakis M. Konstantakopoulou C, et al. Adv Exp Med Biol. 2024;1459:79-94. doi: 10.1007/978-3-031-62731-6_4. Adv Exp Med Biol. 2024. PMID: 39017840 Review.
References
- Petrie HT, Zuniga-Pflucker JC. Zoned out: functional mapping of stromal signaling microenvironments in the thymus. Annu Rev Immunol. 2007;25:649–679. - PubMed
- Rothenberg EV, Anderson MK. Elements of transcription factor network design for T-lineage specification. Dev Biol. 2002;246:29–44. - PubMed
- Bendelac A, Savage PB, Teyton L. The Biology of NKT Cells. Annu Rev Immunol. 2007;25:297–336. - PubMed
- Kronenberg M. Toward an understanding of NKT cell biology: progress and paradoxes. Annu Rev Immunol. 2005;23:877–900. - PubMed
Publication types
MeSH terms
Substances
Grants and funding
- R01 AI059739-01A2/AI/NIAID NIH HHS/United States
- AI059739/AI/NIAID NIH HHS/United States
- T32 CA009149/CA/NCI NIH HHS/United States
- P30-CA 08748/CA/NCI NIH HHS/United States
- R01 AI059739-03/AI/NIAID NIH HHS/United States
- R01 AI059739-02/AI/NIAID NIH HHS/United States
- R01 AI059739/AI/NIAID NIH HHS/United States
LinkOut - more resources
Full Text Sources
Molecular Biology Databases


