CXCR4 antagonism increases T cell trafficking in the central nervous system and improves survival from West Nile virus encephalitis - PubMed (original) (raw)
CXCR4 antagonism increases T cell trafficking in the central nervous system and improves survival from West Nile virus encephalitis
Erin E McCandless et al. Proc Natl Acad Sci U S A. 2008.
Abstract
The migration of lymphocytes into the CNS during viral encephalitis is hindered by the blood-brain barrier (BBB) such that most infiltrating cells remain localized to perivascular spaces. This sequestration of leukocytes away from the parenchyma is believed to protect the CNS from immunopathologic injury. Infections of the CNS with highly cytopathic neurotropic viruses, such as West Nile virus (WNV), however, require the parenchymal penetration of T lymphocytes for virus clearance and survival, suggesting that perivascular localization might hinder antiviral immune responses during WNV encephalitis. Using human and murine brain specimens from individuals with WNV encephalitis, we evaluated the expression of CXCL12 and its receptor, CXCR4, at the BBB and tested the hypothesis that inhibition of CXCR4 would promote T lymphocyte entry into the CNS parenchyma and increase viral clearance. Antagonism of CXCR4 significantly improved survival from lethal infection through enhanced intraparenchymal migration of WNV-specific CD8(+) T cells within the brain, leading to reduced viral loads and, surprisingly, decreased immunopathology at this site. The benefits of enhanced CD8(+) T cell infiltration suggest that pharmacologic targeting of CXCR4 may have therapeutic utility for the treatment of acute viral infections of the CNS.
Conflict of interest statement
The authors declare no conflict of interest.
Figures
Fig. 1.
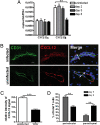
CXCL12 expression in the CNS during WNV encephalitis. (A) QRT-PCR analysis of CXCL12 expression in the CNS of uninfected (white bars) or WNV infected mice (Day 2, light gray bars; Day 5, dark gray bars; and Day 8, black bars). Each group represents at least five individual animals. *, P < 0.05; **; P < 0.005. (B) Confocal immunohistochemical analysis of brain tissue collected from WNV-infected (day 8) (Upper) and uninfected (Lower) mice. Images were stained for CD31 (green), CXCL12 (red), and nuclei (blue). Representative images are shown for five sections, from three mice, in two separate experiments. IC, isotype control. (Scale bar, 10 μm) (C) Relative intensity analysis of CXCL12-stained endothelium in brains of uninfected and WNV-infected (day 8) mice. Data are presented as the average intensity across each vessel for 3–6 mice per group in two separate experiments ±SEM. *, P < 0.001. (D) Quantitative analyses of perivascular versus parenchymal T cells within brains of WNV-infected mice at days 5 (gray bars) and 8 (black bars) after infection. Data are presented as average percentages of T cells as determined by analyzing the associations of CD3+ cells with respect to CD31-stained vessels and counting the numbers of perivascular versus parenchymal cells in 11–19 low power confocal images for 4–5 mice per group ±SEM. *, P < 0.001.
Fig. 2.
CXCR4 expression and activation in the CNS during WNV encephalitis. (A) Sections from WNV-infected brain at day 8 after infection were stained for CD31 (green) and pan-CXCR4 (red) (Left), pCXCR4 (red) (Center), or CD45 (green) and pan-CXCR4 (red) (Right). Pan- and pCXCR4-labeling of perivascular cells are shown with arrowheads (Left and Center), pCXCR4-negative luminal cells are shown with an arrow (Center), and perivascular cells are exclusively leukocytes, shown with arrowheads (Right). Representative images shown are of 10 sections, from three mice, from two independent experiments. IC, isotype control. (Scale bar, 10 μm) (B) QRT-PCR analysis of CXCR4 mRNA levels in brain tissue from uninfected (white bars) and WNV-infected mice at day 2 (light gray bars), 5 (dark gray bars), and 8 (black bars). n = 5 animals per group. (C) Flow cytometric analysis of CNS leukocytes at day 8 after infection through a CXCR4+ gate and immunophenotyped for CD11b+ (Left), CD8+ (Center), and CD4+ (Right). n = 2 experiments with 10 mice per group.
Fig. 3.
Antagonism of CXCR4 and WNV infection. (A) C57BL/6 mice were infected with 10 pfu of WNV and treated with vehicle only (n = 12) or AMD3100 at 142 μg/day (n = 13) via continuous dosing by s.c. osmotic pumps during days 0 to 13 after infection, as indicated by the black line, in two independent experiments. (B and C) Analysis of viral burden in splenic (B) and brain (C) tissues of PBS- (black circles) or AMD3100- (gray squares) treated mice over the time course of infection. Data are from two independent experiments. *, P < 0.05; **, P < 0.005.
Fig. 4.
CXCR4 antagonism promotes intraparenchymal migration of T cells within the brains of WNV-infected mice. (A) Total numbers of leukocytes isolated per brain from PBS- (black circles) and AMD3100- (gray squares) treated mice on days 6 (Left) and 8 (Center) after infection from two independent experiments. (Right) Indicates the fold-change in average cell number of PBS- (black bar) or AMD3100- (gray bar) treated mice between days 6 and 8. (B) Total numbers of CXCR4+ leukocytes isolated per brain (CD11b+, CD8+, and CD4+) from PBS- (black bars) or AMD3100- (gray bars) treated mice. Data reflects two independent experiments. n = 9–11 animals per group; *, P < 0.05. (C) Brain sections from PBS- (Left) and AMD3100- (Right) treated animals at day 6 after infection were stained for CD31 (green), CD3 (red), and nuclei (blue) and visualized at high power. Representative images shown from at least three mice. IC, isotype control. (Scale bar, 50 μm) (D) Quantitation of average number of parenchymal T cells per high power field, as determined by a blinded observer. Shown are 18 images from two AMD3100-treated mice and 14 images from three PBS-treated mice. *, P < 0.05.
Fig. 5.
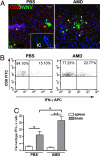
Effect of CXCR4 antagonism on T cell entry and activation in the CNS. CNS tissue from WNV-infected animals treated with PBS or AMD3100 were collected at day 6, when total cell numbers where the same from both groups. (A) Confocal immunohistochemical analysis shows location of CD3+ cells relative to WNV infected neurons. Brain sections from PBS- (Left) and AMD3100- (Right) treated animals were stained for WNV antigen (green), CD3 (red), and nuclei (blue). All images were collected by using identical laser settings to allow for direct intensity comparison. Representative images from at least three mice shown. IC, isotype control.(Scale bar, 50 μm) (B) CD8+ T cells isolated from the CNS of PBS- (Left) and AMD3100- (Right) treated mice were restimulated ex vivo with an NS4B WNV peptide before measurement of IFN-γ production. Representative flow cytometry dot plots depict stained cells shown through a CD8+ T cell gate. (C) Quantification by flow cytometry of NS4B-specific CD8+ cells isolated from spleens and CNS of PBS- (black bars) or AMD3100- (gray bars) treated mice. n = 11 animals per group. Data shown represents two independent experiments. *, P < 0.05.
Fig. 6.
Analysis of glial activation during CXCR4 antagonism. Brain tissues from WNV-infected, PBS- and AMD3100-treated mice were collected on day 8, when the former group continues to worsen whereas the latter group is recovering. (A) Confocal analysis of GFAP (green) and CD3 (red) expression in brain sections from PBS- (Left) or AMD3100- treated mice (Right). Nuclei are counterstained (blue). IC, isotype control. (Scale bar, 10 μm) Representative images shown are from 2–3 mice per group and 6–9 images per mouse. (B) Volocity™ image analysis software was used to quantitate GFAP staining in PBS- (black bars) and AMD3100- (gray bars) treated mice with WNV encephalitis. n = 4. Representative images are taken from two mice. (C) Double-labeling of CNS sections from PBS- (Left) or AMD3100-treated mice (Right) for CD11b (green), CD3 (red), and nuclei (blue). Yellow arrowheads indicate microglial and white arrowheads indicate macrophages. Representative images shown are from 2–3 mice per group and 3–6 images per mouse. (D) Flow cytometric quantitation of total numbers of macrophages (CD45highCD11bhigh) and resting (CD45lowCD11blow) or activated (CD45highCD11blow) microglia from CNS of PBS- (black bars) and AMD3100- (gray bars) treated mice at day 8 after infection with WNV. n = 7–8 animals per group for two experiments. *, P < 0.05.
Similar articles
- IL-1R1 signaling regulates CXCL12-mediated T cell localization and fate within the central nervous system during West Nile Virus encephalitis.
Durrant DM, Daniels BP, Klein RS. Durrant DM, et al. J Immunol. 2014 Oct 15;193(8):4095-106. doi: 10.4049/jimmunol.1401192. Epub 2014 Sep 8. J Immunol. 2014. PMID: 25200953 Free PMC article. - CD40-CD40 ligand interactions promote trafficking of CD8+ T cells into the brain and protection against West Nile virus encephalitis.
Sitati E, McCandless EE, Klein RS, Diamond MS. Sitati E, et al. J Virol. 2007 Sep;81(18):9801-11. doi: 10.1128/JVI.00941-07. Epub 2007 Jul 11. J Virol. 2007. PMID: 17626103 Free PMC article. - Dynamics of Tissue-Specific CD8+ T Cell Responses during West Nile Virus Infection.
Aguilar-Valenzuela R, Netland J, Seo YJ, Bevan MJ, Grakoui A, Suthar MS. Aguilar-Valenzuela R, et al. J Virol. 2018 Apr 27;92(10):e00014-18. doi: 10.1128/JVI.00014-18. Print 2018 May 15. J Virol. 2018. PMID: 29514902 Free PMC article. - Immunological headgear: antiviral immune responses protect against neuroinvasive West Nile virus.
Klein RS, Diamond MS. Klein RS, et al. Trends Mol Med. 2008 Jul;14(7):286-94. doi: 10.1016/j.molmed.2008.05.004. Epub 2008 Jun 6. Trends Mol Med. 2008. PMID: 18539532 Review. - Mechanisms of Immune Evasion of West Nile Virus.
Alghamdi A, Alissa M, Alshehri MA. Alghamdi A, et al. Rev Med Virol. 2025 May;35(3):e70042. doi: 10.1002/rmv.70042. Rev Med Virol. 2025. PMID: 40432246 Review.
Cited by
- The increased intrathecal expression of the monocyte-attracting chemokines CCL7 and CXCL12 in tick-borne encephalitis.
Grygorczuk S, Czupryna P, Pancewicz S, Świerzbińska R, Dunaj J, Siemieniako A, Moniuszko-Malinowska A. Grygorczuk S, et al. J Neurovirol. 2021 Jun;27(3):452-462. doi: 10.1007/s13365-021-00975-z. Epub 2021 Apr 19. J Neurovirol. 2021. PMID: 33876413 - Interferon regulatory factor-1 (IRF-1) shapes both innate and CD8(+) T cell immune responses against West Nile virus infection.
Brien JD, Daffis S, Lazear HM, Cho H, Suthar MS, Gale M Jr, Diamond MS. Brien JD, et al. PLoS Pathog. 2011 Sep;7(9):e1002230. doi: 10.1371/journal.ppat.1002230. Epub 2011 Sep 1. PLoS Pathog. 2011. PMID: 21909274 Free PMC article. - IL-1R1 is required for dendritic cell-mediated T cell reactivation within the CNS during West Nile virus encephalitis.
Durrant DM, Robinette ML, Klein RS. Durrant DM, et al. J Exp Med. 2013 Mar 11;210(3):503-16. doi: 10.1084/jem.20121897. Epub 2013 Mar 4. J Exp Med. 2013. PMID: 23460727 Free PMC article. - T cell-, interleukin-12-, and gamma interferon-driven viral clearance in measles virus-infected brain tissue.
Stubblefield Park SR, Widness M, Levine AD, Patterson CE. Stubblefield Park SR, et al. J Virol. 2011 Apr;85(7):3664-76. doi: 10.1128/JVI.01496-10. Epub 2011 Jan 26. J Virol. 2011. PMID: 21270150 Free PMC article. - New advances in CNS immunity against viral infection.
Manglani M, McGavern DB. Manglani M, et al. Curr Opin Virol. 2018 Feb;28:116-126. doi: 10.1016/j.coviro.2017.12.003. Epub 2017 Dec 29. Curr Opin Virol. 2018. PMID: 29289900 Free PMC article. Review.
References
- Ransohoff RM, Kivisakk P, Kidd G. Three or more routes for leukocyte migration into the central nervous system. Nat Rev Immunol. 2003;3:569–581. - PubMed
- Bouffard JP, Riudavets MA, Holman R, Rushing EJ. Neuropathology of the brain and spinal cord in human West Nile virus infection. Clin Neuropathol. 2004;23:59–61. - PubMed
- McCandless EE, Wang Q, Woerner BM, Harper JM, Klein RS. CXCL12 limits inflammation by localizing mononuclear infiltrates to the perivascular space during experimental autoimmune encephalomyelitis. J Immunol. 2006;177:8053–8064. - PubMed
Publication types
MeSH terms
Substances
LinkOut - more resources
Full Text Sources
Other Literature Sources
Medical
Research Materials


