Insertional oncogenesis in 4 patients after retrovirus-mediated gene therapy of SCID-X1 - PubMed (original) (raw)
Clinical Trial
. 2008 Sep;118(9):3132-42.
doi: 10.1172/JCI35700.
Alexandrine Garrigue, Gary P Wang, Jean Soulier, Annick Lim, Estelle Morillon, Emmanuelle Clappier, Laure Caccavelli, Eric Delabesse, Kheira Beldjord, Vahid Asnafi, Elizabeth MacIntyre, Liliane Dal Cortivo, Isabelle Radford, Nicole Brousse, François Sigaux, Despina Moshous, Julia Hauer, Arndt Borkhardt, Bernd H Belohradsky, Uwe Wintergerst, Maria C Velez, Lily Leiva, Ricardo Sorensen, Nicolas Wulffraat, Stéphane Blanche, Frederic D Bushman, Alain Fischer, Marina Cavazzana-Calvo
Affiliations
- PMID: 18688285
- PMCID: PMC2496963
- DOI: 10.1172/JCI35700
Clinical Trial
Insertional oncogenesis in 4 patients after retrovirus-mediated gene therapy of SCID-X1
Salima Hacein-Bey-Abina et al. J Clin Invest. 2008 Sep.
Abstract
Previously, several individuals with X-linked SCID (SCID-X1) were treated by gene therapy to restore the missing IL-2 receptor gamma (IL2RG) gene to CD34+ BM precursor cells using gammaretroviral vectors. While 9 of 10 patients were successfully treated, 4 of the 9 developed T cell leukemia 31-68 months after gene therapy. In 2 of these cases, blast cells contained activating vector insertions near the LIM domain-only 2 (LMO2) proto-oncogene. Here, we report data on the 2 most recent adverse events, which occurred in patients 7 and 10. In patient 10, blast cells contained an integrated vector near LMO2 and a second integrated vector near the proto-oncogene BMI1. In patient 7, blast cells contained an integrated vector near a third proto-oncogene,CCND2. Additional genetic abnormalities in the patients' blast cells included chromosomal translocations, gain-of-function mutations activating NOTCH1, and copy number changes, including deletion of tumor suppressor gene CDKN2A, 6q interstitial losses, and SIL-TAL1 rearrangement. These findings functionally specify a genetic network that controls growth in T cell progenitors. Chemotherapy led to sustained remission in 3 of the 4 cases of T cell leukemia, but failed in the fourth. Successful chemotherapy was associated with restoration of polyclonal transduced T cell populations. As a result, the treated patients continued to benefit from therapeutic gene transfer.
Figures
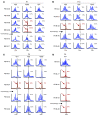
Figure 1. Expression of γc and phosphorylation status of JAK3 in blast cells.
(A) Flow cytometric analysis of γc expression on P7 and P10 cells revealed a normal range of expression on blast cells of P7 at M+68 and P10 at M+33 as well as on normal P7 T cells recovered at M+84, after 16 months of chemotherapy. (B) Tyrosine phosphorylation status of JAK3 in P7 and P10 leukemic blasts after stimulation with 10 ng/ml IL-7 (+) or without stimulation (–; resting cells). Top: Immunoblot used an antibody to phosphotyrosine. Bottom: The same prestripped blot was reprobed with an antibody to JAK3.
Figure 2. Longitudinal immunoscope study of Vβ T lymphocytes.
(A) A loss of polyclonality was found in the Vβ6b family at M+68 in peripheral blood (PB) and BM of P7. After the induction course of chemotherapy, quantitative amplification revealed a disappearance of the pathological clone. (B) In P10 blast cells, 2 clones were detected, Vβ5 and Vβ2, which disappeared 1 month after chemotherapy. (C) Immunoscope analysis of P5 cells (Vβ1, Vβ2, and Vβ23) indicated that 4 years after chemotherapy, the 3 clones displayed a gaussian distribution. (D) Immunoscope analysis of P4 cells indicated that the Vδ1 clone, which had been detected retrospectively 17 months before leukemia diagnosis, remained dominant at M+36, 2 months after chemotherapy. Percentages within graphs denote percent of the Vβ rearrangements.
Figure 3. Structure of vector integration sites in blast cells of P7 and P10.
(A) Sequence mapping to the human genomic database indicated a 100% match to the 5′ CCND2 genomic DNA locus on chromosome 12p13.32 at position 4250758. (B) Sequence mapping to the human genomic database indicated a 100% match to the LMO2 genomic DNA locus on chromosome 11p13 at position 33859782. (C) Sequence mapping to the human genomic database indicated a 100% match to the SPAG6 genomic DNA locus on chromosome 10p12.31 at position 22699645. Integrated retrivorus vectors and genes are represented by white and gray boxes, respectively; numbered boxes represent exons; right- and left-facing arrows indicate forward and reverse orientation, respectively, of the inserted vector.
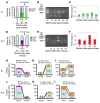
Figure 4. Longitudinal analysis of vector integration sites in P7 and P10.
(A and D) DNA samples from patient cells were digested with restriction enzymes and ligated to linkers, after which integration site sequences were determined by PCR amplification and pyrosequencing. Numbers above bars denote total integration site reads, with composition broken down. PBL, peripheral blood lymphocytes. Longitudinal analysis of samples from P7 (A) and P10 (D). Time of chemotherapy is indicated by the arrow. (B and E) Analysis of genomic DNA samples by ligation-mediated PCR, separation by electrophoresis on an agarose gel, and staining with ethidium bromide. (B) In P7, the intense band in the M+68 sample had the mobility expected for the CCND2 amplification product. (E) In P10, bands of the expected sizes were observed for the LMO2 and BMI1 amplification products in the M+33 sample. (C and F) Longitudinal vector copy number analysis. Quantitative real-time PCR analysis of PBMC DNA from P7 and P10 obtained at the indicated times after gene therapy. (C) P7 showed 1 integrated copy in the leukemic blasts at M+68, concordant with the unique detected integration site. (F) In P10, 2 integrated copies at M+33 were detected, contrasting with the 1 copy detected before and after chemotherapy. These data confirmed that there is 1 leukemic clone bearing the 2 proviral integration sites, LMO2 and BMI1. (G–L) Number of integration sites shared (pink, yellow, and orange) versus not shared (gray) at the indicated time points for P7 (G–I) and P10 (J–L).
Figure 5. Expression of proto-oncogenes.
(A) CCND2 expression analysis in P7 blast cells compared with a series of primary T-ALL cases from different oncogenic subgroups — CCND2-rearranged cases (TCR-CCND2; n = 3) and other T-ALL primary cases (T-ALL; n = 86) — and with normal thymus (n = 3). CCND2 expression levels are shown as copy number value in a given sample related to TBP copy number in the series, as determined using the ΔCt method. CCND2 levels in 11 normal human thymic subpopulations were previously analyzed for comparison and showed varied gene expression depending on the cells’ stage of thymic differentiation (18). Results are presented as a box plot: the box boundaries indicates the twenty-fifth and seventy-fifth percentiles; the line within the box denotes the median; whiskers denote tenth and ninetieth percentiles; outliers are indicated as dots. (B) RQ-PCR of SPAG6, BMI1, COMMD3, and DNAJC1 genes in P10 leukemic sample at M+33 compared with CALM-AF10–positive (CA+; n = 14) and –negative (CA–; n = 31) samples. The ratio of gene expression relative to ABL was calculated for each sample. Below, the genomic organization around the AF10 breakpoint is presented along with the location of the γc retrovirus insertion. (C) Longitudinal expression of LMO2 in P10 as determined by RQ-PCR.
Figure 6. Genome-wide copy number analysis by array-CGH.
(A) Array-CGH analysis of chromosome 9. The moving average ratio between leukemic and germline DNA is shown by colored lines. Biallelic deletions, including the CDKN2A locus, were detected in P4 and P7. A 14-Mb region at 9p21 is shown magnified at right. (B) A 90-kb deletion was observed between the SIL and TAL1 genes at 1p33 in P5 (green). This microdeletion corresponded to a SIL-TAL1 oncogenic rearrangement. (C) Copy number analysis of chromosome 6. Interstitial 6q deletion in P4 and P7, and gain (4 copies, and then 3 copies) in P4 are shown. (D) Copy number analysis of chromosome 7. A loss of the short arm (–7p) and gain of the long arm (+7q) in P7 (red) is shown. As expected in clonal T cell proliferation, the TCRG and TCRB loci were deleted at 7p13 and 7q34, respectively.
Figure 7. Pathways involved in the 4 adverse events.
Interactions among genes affected in the 4 adverse events were determined as described in Methods. Red symbols denote genes identified by insertional activation in the 4 adverse events. Orange symbols denote genes identified by copy number alterations or point mutations. The therapeutic transgene IL2RG is shown in blue. For ease of visualization, the network was limited to genes directly connected to 1 of the 7 functionally identified genes or the transgene IL2RG; all except STIL were connected in a tightly linked network.
Similar articles
- Insertional mutagenesis combined with acquired somatic mutations causes leukemogenesis following gene therapy of SCID-X1 patients.
Howe SJ, Mansour MR, Schwarzwaelder K, Bartholomae C, Hubank M, Kempski H, Brugman MH, Pike-Overzet K, Chatters SJ, de Ridder D, Gilmour KC, Adams S, Thornhill SI, Parsley KL, Staal FJ, Gale RE, Linch DC, Bayford J, Brown L, Quaye M, Kinnon C, Ancliff P, Webb DK, Schmidt M, von Kalle C, Gaspar HB, Thrasher AJ. Howe SJ, et al. J Clin Invest. 2008 Sep;118(9):3143-50. doi: 10.1172/JCI35798. J Clin Invest. 2008. PMID: 18688286 Free PMC article. Clinical Trial. - Ectopic retroviral expression of LMO2, but not IL2Rgamma, blocks human T-cell development from CD34+ cells: implications for leukemogenesis in gene therapy.
Pike-Overzet K, de Ridder D, Weerkamp F, Baert MR, Verstegen MM, Brugman MH, Howe SJ, Reinders MJ, Thrasher AJ, Wagemaker G, van Dongen JJ, Staal FJ. Pike-Overzet K, et al. Leukemia. 2007 Apr;21(4):754-63. doi: 10.1038/sj.leu.2404563. Epub 2007 Feb 1. Leukemia. 2007. PMID: 17268520 - Murine leukemias with retroviral insertions at Lmo2 are predictive of the leukemias induced in SCID-X1 patients following retroviral gene therapy.
Davé UP, Akagi K, Tripathi R, Cleveland SM, Thompson MA, Yi M, Stephens R, Downing JR, Jenkins NA, Copeland NG. Davé UP, et al. PLoS Genet. 2009 May;5(5):e1000491. doi: 10.1371/journal.pgen.1000491. Epub 2009 May 22. PLoS Genet. 2009. PMID: 19461887 Free PMC article. - Stem cell clonality and genotoxicity in hematopoietic cells: gene activation side effects should be avoidable.
von Kalle C, Fehse B, Layh-Schmitt G, Schmidt M, Kelly P, Baum C. von Kalle C, et al. Semin Hematol. 2004 Oct;41(4):303-18. doi: 10.1053/j.seminhematol.2004.07.007. Semin Hematol. 2004. PMID: 15508116 Review. - [Development and application of gene therapy technologies].
Ozawa K. Ozawa K. Uirusu. 2004 Jun;54(1):49-57. doi: 10.2222/jsv.54.49. Uirusu. 2004. PMID: 15449904 Review. Japanese.
Cited by
- LIM-domain-only proteins in cancer.
Matthews JM, Lester K, Joseph S, Curtis DJ. Matthews JM, et al. Nat Rev Cancer. 2013 Feb;13(2):111-22. doi: 10.1038/nrc3418. Epub 2013 Jan 10. Nat Rev Cancer. 2013. PMID: 23303138 Review. - Estimating abundances of retroviral insertion sites from DNA fragment length data.
Berry CC, Gillet NA, Melamed A, Gormley N, Bangham CR, Bushman FD. Berry CC, et al. Bioinformatics. 2012 Mar 15;28(6):755-62. doi: 10.1093/bioinformatics/bts004. Epub 2012 Jan 11. Bioinformatics. 2012. PMID: 22238265 Free PMC article. - Potential of transposon-mediated cellular reprogramming towards cell-based therapies.
Kumar D, Anand T, Talluri TR, Kues WA. Kumar D, et al. World J Stem Cells. 2020 Jul 26;12(7):527-544. doi: 10.4252/wjsc.v12.i7.527. World J Stem Cells. 2020. PMID: 32843912 Free PMC article. Review. - Lentiviral hematopoietic stem cell gene therapy in patients with Wiskott-Aldrich syndrome.
Aiuti A, Biasco L, Scaramuzza S, Ferrua F, Cicalese MP, Baricordi C, Dionisio F, Calabria A, Giannelli S, Castiello MC, Bosticardo M, Evangelio C, Assanelli A, Casiraghi M, Di Nunzio S, Callegaro L, Benati C, Rizzardi P, Pellin D, Di Serio C, Schmidt M, Von Kalle C, Gardner J, Mehta N, Neduva V, Dow DJ, Galy A, Miniero R, Finocchi A, Metin A, Banerjee PP, Orange JS, Galimberti S, Valsecchi MG, Biffi A, Montini E, Villa A, Ciceri F, Roncarolo MG, Naldini L. Aiuti A, et al. Science. 2013 Aug 23;341(6148):1233151. doi: 10.1126/science.1233151. Epub 2013 Jul 11. Science. 2013. PMID: 23845947 Free PMC article. Clinical Trial. - Genome-edited allogeneic donor "universal" chimeric antigen receptor T cells.
Qasim W. Qasim W. Blood. 2023 Feb 23;141(8):835-845. doi: 10.1182/blood.2022016204. Blood. 2023. PMID: 36223560 Free PMC article.
References
Publication types
MeSH terms
Substances
Grants and funding
- AI66290/AI/NIAID NIH HHS/United States
- U19 AI066290/AI/NIAID NIH HHS/United States
- T32 AI07634/AI/NIAID NIH HHS/United States
- AI52845/AI/NIAID NIH HHS/United States
- R01 AI052845/AI/NIAID NIH HHS/United States
- T32 AI007634/AI/NIAID NIH HHS/United States
LinkOut - more resources
Full Text Sources
Other Literature Sources
Medical
Research Materials
Miscellaneous


