The role of the polycomb complex in silencing alpha-globin gene expression in nonerythroid cells - PubMed (original) (raw)
. 2008 Nov 1;112(9):3889-99.
doi: 10.1182/blood-2008-06-161901. Epub 2008 Aug 8.
Marco De Gobbi, Vasiliki Samara, Michelle Rugless, Michelle Holland, Helena Ayyub, Karen Lower, Jackie Sloane-Stanley, Nicki Gray, Christoph Koch, Ian Dunham, Douglas R Higgs
Affiliations
- PMID: 18689541
- PMCID: PMC2572806
- DOI: 10.1182/blood-2008-06-161901
The role of the polycomb complex in silencing alpha-globin gene expression in nonerythroid cells
David Garrick et al. Blood. 2008.
Abstract
Although much is known about globin gene activation in erythroid cells, relatively little is known about how these genes are silenced in nonerythroid tissues. Here we show that the human alpha- and beta-globin genes are silenced by fundamentally different mechanisms. The alpha-genes, which are surrounded by widely expressed genes in a gene dense region of the genome, are silenced very early in development via recruitment of the Polycomb (PcG) complex. By contrast, the beta-globin genes, which lie in a relatively gene-poor chromosomal region, are not bound by this complex in nonerythroid cells. The PcG complex seems to be recruited to the alpha-cluster by sequences within the CpG islands associated with their promoters; the beta-globin promoters do not lie within such islands. Chromatin associated with the alpha-globin cluster is modified by histone methylation (H3K27me3), and silencing in vivo is mediated by the localized activity of histone deacetylases (HDACs). The repressive (PcG/HDAC) machinery is removed as hematopoietic progenitors differentiate to form erythroid cells. The alpha- and beta-globin genes thus illustrate important, contrasting mechanisms by which cell-specific hematopoietic genes (and tissue-specific genes in general) may be silenced.
Figures
Figure 1
Overview of the human α-globin (HBA) locus (16p13.3). Genes of the α-locus are shown in black and other genes are in gray. Pseudogenes are in white. Genes shown above the line are transcribed toward the centromere and those below the line are transcribed toward the telomere (black oval). The gray bar above indicates the domain of erythroid-specific histone hyperacetylation. Below are indicated CpG islands (black bars), and previously documented erythroid-specific (black arrows) and ubiquitous (gray arrows) DNaseI hypersensitive sites. * indicates HS analyzed in this study. At bottom is shown the position of real-time PCR amplicons used to analyze quantitative ChIP experiments (gray bars). The probes spanning the duplicated adult stage-specific HBA genes (boxed) do not distinguish the HBA2 and HBA1 genes.
Figure 2
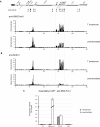
The PRC2 polycomb complex is recruited to the inactive HBA genes. ChIP experiments were carried out in primary T lymphocytes or primary proerythroblasts using antibodies against H3K27me3 (A), SUZ12 (B), or RNA pol II (C). For (A) and (B), immunoprecipitated and input material were labeled with Cy3 or Cy5, respectively, and applied to a custom tiled microarray covering the terminal region of human chromosome 16. Shown is a 250-kb genomic segment containing the α-globin locus (delineated by gray dashed lines) with the fold enrichments at each probe plotted against chromosomal position. The locus is annotated as described in Figure 1. For panel C, immunoprecipitated material was analyzed by real-time PCR at amplicons 53 (within the middle of the DIST1 gene [see Figure 1]) and an amplicon within the 18S rRNA gene (both representing background enrichment), an amplicon at the promoter of the β-actin gene (ACTB) used as a positive control, and an amplicon spanning exons 1-2 of the adult HBA genes (HBA ex1-2; see Figure 1). Data indicate the percentage of input material precipitated at each amplicon. Shown are the mean values obtained from replicate ChIPs with error bars indicating the range of values.
Figure 3
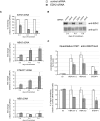
Induction of HBA expression after siRNA-mediated depletion of EZH2 in nonerythroid cells. HeLa cells were transfected with either control siRNA or EZH2-specific siRNA and were harvested every 2 days over a 6-day time course as shown. (A) Real time RT-PCR analysis of EZH2, HBA2, STEAP1, and HBB expression. Results are shown as either the percentage of EZH2 signal remaining (top panel) or the fold change (bottom panels) in the EZH2 siRNA-treated population relative to the control siRNA–treated population after normalizing for glyceraldehyde-3-phosphate dehydrogenase (GAPDH) signal. (B) Protein extracts from a representative time course analyzed by Western blot using antibodies against EZH2 (top panel) or RNA polymerase II as loading control (bottom panel). (C) Chromatin was harvested after 6 days with the indicated siRNA and was analyzed by quantitative ChIP using an antibody against H3K27me3. Material was analyzed by real-time PCR at amplicons 53 (background enrichment only), HBA ex1-2 and HBA ex3 from the α-globin genes (see Figure 1) and the CpG-island of the STEAP1 gene. Data are presented as either raw enrichment (the percentage of input material precipitated at each amplicon; top panel) or the percentage of signal remaining in the EZH2 siRNA-treated cells relative to control siRNA–treated cells (bottom panel). Data in panels A and C show the mean values obtained from replicate time courses with error bars indicating the range of values.
Figure 4
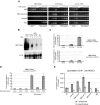
The HBA genes are repressed by histone deacetylases in nonerythroid cells. (A) Semiquantitative RT-PCR analysis of HBA2, ACTB, and LUC7L cDNA in the cell lines indicated that were either mock-treated, or treated with 0.2 μmol/L TSA for 24 hours. (B) Northern blot analysis of RNA from the cell lines indicated that were either mock-treated (−) or treated with 0.2 μmol/L TSA for 24 hours (+). The membrane was hybridized first to a probe which recognizes transcripts from both HBA1 and HBA2 genes (top panel) and subsequently to an ACTB cDNA probe as loading control (bottom panel). (C) Real-time RT-PCR analysis of HBA2 and HBB cDNA in EBV-lymphocytes that were either mock-treated or treated with 0.2 μmol/L TSA for 4 or 8 hours. Results are shown as fold change relative to mock-treated cells, after normalizing for GAPDH signal. (D) Real time RT-PCR analysis of HBA2 cDNA in EBV-lymphocyte cultures that were either mock-treated or treated with 0.2 μmol/L TSA for 8 hours, in the presence of either no secondary drug or actinomycin D or cycloheximide as indicated. Results are shown as fold change relative to mock-treated cells (with no secondary drug), after normalizing for GAPDH signal. Shown is the mean of replicate experiments, with error bars indicating the range. For each experiment, PCR was performed in triplicate. (E) ChIP experiments were carried out on primary T lymphocytes or proerythroblasts using an antibody against HDAC1, and material was analyzed at the amplicons indicated surrounding the α-globin locus (shown in Figure 1) or a control amplicon within the 18S rRNA gene. Shown are the mean values obtained from replicate experiments with error bars indicating the range.
Figure 5
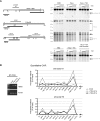
Chromatin changes at the HBA genes in response to HDAC-inhibition. (A) Restriction enzyme accessibility assays performed on nuclei from K562 cells, mock-treated HeLa cells, or HeLa cells treated with 0.2 μmol/L TSA for 8 hours. Nuclei were exposed to no enzyme (0) or increasing concentrations of HinfI. Shown are Southern blots to detect hypersensitive sites at the α-globin promoters, HS-40 and HS-74, as indicated. The limit digested bands are indicated by black arrows, and bands resulting from digestion by HinfI within HSs are indicated by gray arrows. The limit digested fragments analyzed on each membrane are shown at left (H, HinfI; P, PstI; E, EcoRI; Hd, HindIII). The previously mapped extent of the known hypersensitive sites (open bars) and the probes used (black bars) are indicated. Genes are shown as block arrows. In the bottom panel, the HBA promoter HS was analyzed in nuclei from K562 cells, HeLa cells after treatment with TSA, or HeLa cells which were treated with TSA and then cultured for a further 24 hours in the absence of TSA. (B) Left panel: RT-PCR analysis of HBA2 cDNA (31 cycles) and ACTB cDNA (26 cycles) in an EBV-lymphoblastoid culture which was either mock-treated, or treated with 0.2 μmol/L TSA for 4 or 8 hours. Right panels: ChIP experiments carried out on the EBV-lymphoblastoid cells analyzed by RT-PCR, using antibodies against either acetylated histone H3 or histone H4. Immunoprecipitated material was analyzed by real-time PCR at the amplicons indicated surrounding the α-globin locus (shown in Figure 1) or a control amplicon within the 18S rRNA gene. Data indicate the percentage of input material precipitated at each amplicon.
Figure 6
PcG-regulation at the HBA genes in human ES cells. (A) ChIP experiments carried out in human ES cells using antibodies against SUZ12 (top panel) or H3K27me3 (bottom panel). Immunoprecipitated material was analyzed at amplicons surrounding the α-globin locus (Figure 1) or at the β-globin gene promoter, 3′ of the β-globin gene, within HS5 of the β-globin locus control region (probes HBB ex1, 3′HBB, and βLCR HS5) or a control amplicon within the 18S rRNA gene. Data indicate the percentage of input material precipitated at each amplicon. (B) Real-time RT-PCR analysis of HBA2 cDNA in human ES cells which were either mock-treated, or treated with 0.2 μmol/L TSA for 8 hours. Results are shown as fold change relative to mock-treated cells after normalizing for GAPDH signal. Data in panels A and B show the mean values obtained from replicate experiments with error bars indicating the range of values.
Similar articles
- Recruitment of coregulator complexes to the beta-globin gene locus by TFII-I and upstream stimulatory factor.
Crusselle-Davis VJ, Zhou Z, Anantharaman A, Moghimi B, Dodev T, Huang S, Bungert J. Crusselle-Davis VJ, et al. FEBS J. 2007 Dec;274(23):6065-73. doi: 10.1111/j.1742-4658.2007.06128.x. Epub 2007 Oct 26. FEBS J. 2007. PMID: 17970752 - Role of hPHF1 in H3K27 methylation and Hox gene silencing.
Cao R, Wang H, He J, Erdjument-Bromage H, Tempst P, Zhang Y. Cao R, et al. Mol Cell Biol. 2008 Mar;28(5):1862-72. doi: 10.1128/MCB.01589-07. Epub 2007 Dec 17. Mol Cell Biol. 2008. PMID: 18086877 Free PMC article. - PcG proteins, DNA methylation, and gene repression by chromatin looping.
Tiwari VK, McGarvey KM, Licchesi JD, Ohm JE, Herman JG, Schübeler D, Baylin SB. Tiwari VK, et al. PLoS Biol. 2008 Dec 2;6(12):2911-27. doi: 10.1371/journal.pbio.0060306. PLoS Biol. 2008. PMID: 19053175 Free PMC article. - Multiple binding of methyl-CpG and polycomb proteins in long-term gene silencing events.
Matarazzo MR, De Bonis ML, Strazzullo M, Cerase A, Ferraro M, Vastarelli P, Ballestar E, Esteller M, Kudo S, D'Esposito M. Matarazzo MR, et al. J Cell Physiol. 2007 Mar;210(3):711-9. doi: 10.1002/jcp.20879. J Cell Physiol. 2007. PMID: 17133344 - Epigenetic regulation of fetal globin gene expression in adult erythroid cells.
Ginder GD. Ginder GD. Transl Res. 2015 Jan;165(1):115-25. doi: 10.1016/j.trsl.2014.05.002. Epub 2014 May 11. Transl Res. 2015. PMID: 24880147 Free PMC article. Review.
Cited by
- H3K27me3 forms BLOCs over silent genes and intergenic regions and specifies a histone banding pattern on a mouse autosomal chromosome.
Pauler FM, Sloane MA, Huang R, Regha K, Koerner MV, Tamir I, Sommer A, Aszodi A, Jenuwein T, Barlow DP. Pauler FM, et al. Genome Res. 2009 Feb;19(2):221-33. doi: 10.1101/gr.080861.108. Epub 2008 Dec 1. Genome Res. 2009. PMID: 19047520 Free PMC article. - Histone code pathway involving H3 S28 phosphorylation and K27 acetylation activates transcription and antagonizes polycomb silencing.
Lau PN, Cheung P. Lau PN, et al. Proc Natl Acad Sci U S A. 2011 Feb 15;108(7):2801-6. doi: 10.1073/pnas.1012798108. Epub 2011 Jan 31. Proc Natl Acad Sci U S A. 2011. PMID: 21282660 Free PMC article. - Differential regulation of the α-globin locus by Krüppel-like Factor 3 in erythroid and non-erythroid cells.
Funnell AP, Vernimmen D, Lim WF, Mak KS, Wienert B, Martyn GE, Artuz CM, Burdach J, Quinlan KG, Higgs DR, Whitelaw E, Pearson RC, Crossley M. Funnell AP, et al. BMC Mol Biol. 2014 May 16;15:8. doi: 10.1186/1471-2199-15-8. BMC Mol Biol. 2014. PMID: 24885809 Free PMC article. - DNA methylation of intragenic CpG islands depends on their transcriptional activity during differentiation and disease.
Jeziorska DM, Murray RJS, De Gobbi M, Gaentzsch R, Garrick D, Ayyub H, Chen T, Li E, Telenius J, Lynch M, Graham B, Smith AJH, Lund JN, Hughes JR, Higgs DR, Tufarelli C. Jeziorska DM, et al. Proc Natl Acad Sci U S A. 2017 Sep 5;114(36):E7526-E7535. doi: 10.1073/pnas.1703087114. Epub 2017 Aug 21. Proc Natl Acad Sci U S A. 2017. PMID: 28827334 Free PMC article. - Disruption of long-range gene regulation in human genetic disease: a kaleidoscope of general principles, diverse mechanisms and unique phenotypic consequences.
Bhatia S, Kleinjan DA. Bhatia S, et al. Hum Genet. 2014 Jul;133(7):815-45. doi: 10.1007/s00439-014-1424-6. Epub 2014 Feb 5. Hum Genet. 2014. PMID: 24496500 Review.
References
- Higgs DR, Vernimmen D, De Gobbi M, et al. How transcriptional and epigenetic programmes are played out on an individual mammalian gene cluster during lineage commitment and differentiation. Biochem Soc Symp. 2006;73:11–22. - PubMed
- Flint J, Thomas K, Micklem G, et al. The relationship between chromosome structure and function at a human telomeric region. Nat Genet. 1997;15:252–257. - PubMed
- Smith ZE, Higgs DR. The pattern of replication at a human telomeric region (16p13.3): its relationship to chromosome structure and gene expression. Hum Mol Genet. 1999;8:1373–1386. - PubMed
- Brown KE, Amoils S, Horn JM, et al. Expression of alpha- and beta-globin genes occurs within different nuclear domains in haemopoietic cells. Nat Cell Biol. 2001;3:602–606. - PubMed
Publication types
MeSH terms
Substances
LinkOut - more resources
Full Text Sources
Molecular Biology Databases


