Differentiation of regulatory Foxp3+ T cells in the thymic cortex - PubMed (original) (raw)
Differentiation of regulatory Foxp3+ T cells in the thymic cortex
Adrian Liston et al. Proc Natl Acad Sci U S A. 2008.
Abstract
Regulatory Foxp3(+) T cells (T(R)) are indispensable for preventing autoimmune pathology in multiple organs and tissues. During thymic differentiation T cell receptor (TCR)-ligand interactions within a certain increased affinity range, in conjunction with gammac-containing cytokine receptor signals, induce Foxp3 expression and thereby commit developing thymocytes to the T(R) lineage. The contribution of distinct MHC class II-expressing accessory cell types to the differentiation process of Foxp3(+) thymocytes remains controversial, because a unique role in this process has been ascribed to either thymic dendritic cells (tDC) or to medullary thymic epithelial cells (mTEC). Furthermore, it was suggested that the thymic medulla, where the bulk of the negative selection of self-reactive thymocytes takes place, provides a specialized microenvironment supporting T(R) differentiation. Here, we report that the cortex, as defined by cortical thymic epithelial cells (cTEC), is sufficient for supporting T(R) differentiation. MHC class II expression restricted to both cTEC and mTEC or to cTEC alone did not significantly affect the numbers of Foxp3(+) thymocytes. Furthermore, genetic or pharmacologic blockade of thymocyte migration resulted in a prominent accumulation of Foxp3(+) thymocytes in the cortex, demonstrating that secondary signals required for Foxp3 up-regulation exist in the cortex. Our results suggest that mTEC or tDC do not serve as a cell type singularly responsible for T(R) differentiation and that neither the cortex nor the medulla exclusively provides an environment suitable for Foxp3 induction. Instead, multiple accessory cell types probably contribute to the thymic generation of regulatory Foxp3(+) T cells.
Conflict of interest statement
The authors declare no conflict of interest.
Figures
Fig. 1.
Hemopoietic MHC class II expression is dispensable for commitment to the Foxp3+ lineage or gain of suppressor function. (a) B6 mice were irradiated and reconstituted with either Foxp3GFP or MHC class II–deficient Foxp3GFP BM. Eight weeks after reconstitution, commitment to the Foxp3+ lineage was analyzed by flow cytometry; representative flow profiles are shown (n = 10,6). (b) Percentages of SP thymocytes that express Foxp3 and (c) absolute number of Foxp3+ SP thymocytes from Foxp3GFP → B6 and Ab1null Foxp3GFP → B6 chimeras (mean ± standard deviation). (d) CD11c-Cre transgenic mice crossed with IAb flx/flx mice showed highly efficient ablation of MHC class II expression on thymic CD11c+ cells (black line = Cre−; red line = Cre+). Representative profiles (n = 3): (e) flow cytometric analysis of the absolute number of CD4 SP thymocytes, (f) the percentage of CD4 SP thymocytes that express Foxp3, and (g) the absolute number of Foxp3+ SP cells (mean ± standard deviation).
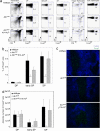
Fig. 2.
TCR–MHC interactions in the medulla are not necessary for Foxp3+ TR cell commitment. Foxp3+ TR cell differentiation was compared in wild type, Ab1null, and Ab1null K14-Aβb transgenic mice. (a) Representative flow cytometric profiles showing wild type, Ab1null, and Ab1null K14-Aβb transgenic CD4, CD8, and Foxp3 expression in the DP, early SP, SP, and CD4+ splenocyte populations. (b) Percentage of thymocytes expressing Foxp3 at the DP, early SP, and SP stages, for wild type (n = 19, black bar), Ab1null (n = 10, white bar), and Ab1null K14-Aβb transgenic (n = 12, gray bar) mice. (c) Localization of Foxp3+ cells (Foxp3, green) in the thymic cortex (CDR1/6C3, blue) and medulla (unlabeled) of wild type (top), Ab1null (middle), and Ab1null (bottom) K14-Aβb transgenic mice. Results are representative of four experiments. (d) Average absolute number of thymocytes expressing Foxp3 at the DP, early SP, and SP stages.
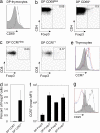
Fig. 3.
DP Foxp3+ cells are postselection. (a) Foxp3+ DP cells (line) compared with Foxp3− DP cells (shaded) for CD69 expression. (b) Proportion of Foxp3+ cells among DP CD69− cells (Left) and DP CD69+ cells (Right). Results are representative of three experiments. (c) Proportion of Foxp3+ cells among CCR7− DP cells (Left) and CCR7+ DP cells (Right). (d) Percentage of CCR7− DP and CCR7+ DP cells that are Foxp3+ (mean ± standard deviation, n = 5). (e) Representative histograms and (f) average (mean ± standard deviation, n = 5) of CCR7 expression on Foxp3− DP cells (solid gray area), Foxp3+ DP cells (black line), Foxp3− SP cells (blue line), and Foxp3+ SP cells (red line). (g) CD25 expression on Foxp3− DP (red line), Foxp3− SP (blue line), Foxp3+ SP (black line), and Foxp3+ DP (solid gray area) cells (representative of n = 10).
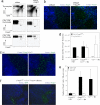
Fig. 4.
Retention of SP cells in the thymic cortex does not impede Foxp3 commitment. The thymuses of PT-treated mice and CCR7-deficient mice were analyzed for Foxp3+ T cell location. (a) CD4-CD8 profiles and Foxp3 expression within DP and SP populations for untreated and PT-treated mice (representative sections, n = 6). (b) Thymic sections from untreated and PT-treated mice stained for Foxp3 (green) and CDR1/6C3 (cortex, blue) (representative sections, n = 6). (c) Thymic sections from wild type and _Ccr_−/− mice stained for Foxp3 (green) and CDR1/6C3 (cortex, blue). (d) Number of Foxp3+ thymocytes in Ly5.1 Foxp3GFP BM, Ly5.1 Foxp3GFP + Ly5.2 _Ccr7_−/− mixed BM, and Ly5.2 _Ccr7_−/− BM chimeras, for Ly5.1 (wild type, black bar) and Ly5.2 (_Ccr7_−/−, white bar) cells, corrected for degree of BM chimerism. (e) Number of Foxp3+ cells in the cortex of Ly5.1 Foxp3GFP BM, Ly5.1 Foxp3GFP + Ly5.2 _Ccr7_−/− mixed BM, and Ly5.2 _Ccr7_−/− BM chimeras, using Foxp3 (Left) or GFP (Right). n = 5. (f) Thymic sections from Ly5.1 Foxp3GFP + Ly5.2 _Ccr7_−/− mixed BM chimeras, stained for CDR1/6C3 (cortex, blue) and either GFP (green; left) or Foxp3 (green; right) (representative sections, n = 5).
Fig. 5.
Product–precursor relationship between DP and SP Foxp3+ thymocytes. (a) Representative flow profiles of regenerated GFP+ cells in Foxp3wt/DTR-GFP mice treated with two doses of DT at day −1 and day 0 and traced for reconstitution of GFP+ cells. (b) Mean ± standard deviation (n = 3, 4, 4, 4, 3, 2) for the absolute number of Foxp3+ DP and Foxp3+ SP cells. Day 0.1 represents mice injected with DT at day −1 and at −2 h. Short and long dashes indicate numbers of SP and DP GFP+ cells, respectively, in uninjected mice. (c) Expression of CD8 (Left) and Foxp3Thy1.1 (Right) on Ly5.1+Ly5.2- thymocytes (shaded) and purified Ly5.2 DP Foxp3Thy1.1+ thymocytes 18 h after intrathymic injection into Lys5.1 mice.
Similar articles
- Selection of Foxp3+ regulatory T cells specific for self antigen expressed and presented by Aire+ medullary thymic epithelial cells.
Aschenbrenner K, D'Cruz LM, Vollmann EH, Hinterberger M, Emmerich J, Swee LK, Rolink A, Klein L. Aschenbrenner K, et al. Nat Immunol. 2007 Apr;8(4):351-8. doi: 10.1038/ni1444. Epub 2007 Feb 25. Nat Immunol. 2007. PMID: 17322887 - The thymic medulla is required for Foxp3+ regulatory but not conventional CD4+ thymocyte development.
Cowan JE, Parnell SM, Nakamura K, Caamano JH, Lane PJ, Jenkinson EJ, Jenkinson WE, Anderson G. Cowan JE, et al. J Exp Med. 2013 Apr 8;210(4):675-81. doi: 10.1084/jem.20122070. Epub 2013 Mar 25. J Exp Med. 2013. PMID: 23530124 Free PMC article. - Thymic microenvironments for T-cell repertoire formation.
Nitta T, Murata S, Ueno T, Tanaka K, Takahama Y. Nitta T, et al. Adv Immunol. 2008;99:59-94. doi: 10.1016/S0065-2776(08)00603-2. Adv Immunol. 2008. PMID: 19117532 Review. - Foxp3+ regulatory T cells promiscuously accept thymic signals critical for their development.
Spence PJ, Green EA. Spence PJ, et al. Proc Natl Acad Sci U S A. 2008 Jan 22;105(3):973-8. doi: 10.1073/pnas.0709071105. Epub 2008 Jan 15. Proc Natl Acad Sci U S A. 2008. PMID: 18198277 Free PMC article. - Development of thymic Foxp3(+) regulatory T cells: TGF-β matters.
Chen W, Konkel JE. Chen W, et al. Eur J Immunol. 2015 Apr;45(4):958-65. doi: 10.1002/eji.201444999. Epub 2015 Mar 18. Eur J Immunol. 2015. PMID: 25684698 Free PMC article. Review.
Cited by
- Obesity alters pathology and treatment response in inflammatory disease.
Bapat SP, Whitty C, Mowery CT, Liang Y, Yoo A, Jiang Z, Peters MC, Zhang LJ, Vogel I, Zhou C, Nguyen VQ, Li Z, Chang C, Zhu WS, Hastie AT, He H, Ren X, Qiu W, Gayer SG, Liu C, Choi EJ, Fassett M, Cohen JN, Sturgill JL, Crotty Alexander LE, Suh JM, Liddle C, Atkins AR, Yu RT, Downes M, Liu S, Nikolajczyk BS, Lee IK, Guttman-Yassky E, Ansel KM, Woodruff PG, Fahy JV, Sheppard D, Gallo RL, Ye CJ, Evans RM, Zheng Y, Marson A. Bapat SP, et al. Nature. 2022 Apr;604(7905):337-342. doi: 10.1038/s41586-022-04536-0. Epub 2022 Mar 30. Nature. 2022. PMID: 35355021 Free PMC article. - Inflammation-induced Id2 promotes plasticity in regulatory T cells.
Hwang SM, Sharma G, Verma R, Byun S, Rudra D, Im SH. Hwang SM, et al. Nat Commun. 2018 Nov 9;9(1):4736. doi: 10.1038/s41467-018-07254-2. Nat Commun. 2018. PMID: 30413714 Free PMC article. - How Thymocyte Deletion in the Cortex May Curtail Antigen-Specific T-Regulatory Cell Development in the Medulla.
Wang C, Daley SR. Wang C, et al. Front Immunol. 2022 May 25;13:892498. doi: 10.3389/fimmu.2022.892498. eCollection 2022. Front Immunol. 2022. PMID: 35693793 Free PMC article. - Rare development of Foxp3+ thymocytes in the CD4+CD8+ subset.
Lee HM, Hsieh CS. Lee HM, et al. J Immunol. 2009 Aug 15;183(4):2261-6. doi: 10.4049/jimmunol.0901304. Epub 2009 Jul 20. J Immunol. 2009. PMID: 19620303 Free PMC article. - A regulatory role for TGF-β signaling in the establishment and function of the thymic medulla.
Hauri-Hohl M, Zuklys S, Holländer GA, Ziegler SF. Hauri-Hohl M, et al. Nat Immunol. 2014 Jun;15(6):554-61. doi: 10.1038/ni.2869. Epub 2014 Apr 13. Nat Immunol. 2014. PMID: 24728352
References
- Kim JM, Rasmussen JP, Rudensky AY. Regulatory T cells prevent catastrophic autoimmunity throughout the lifespan of mice. Nat Immunol. 2007;8:191–197. - PubMed
- Fontenot JD, Gavin MA, Rudensky AY. Foxp3 programs the development and function of CD4+CD25+ regulatory T cells. Nat Immunol. 2003;4:330–336. - PubMed
- Gavin MA, et al. Foxp3-dependent programme of regulatory T-cell differentiation. Nature. 2007;445:771–775. - PubMed
- Zheng Y, et al. Genome-wide analysis of Foxp3 target genes in developing and mature regulatory T cells. Nature. 2007;445:936–940. - PubMed
- Williams LM, Rudensky AY. Maintenance of the Foxp3-dependent developmental program in mature regulatory T cells requires continued expression of Foxp3. Nat Immunol. 2007;8:277–284. - PubMed
Publication types
MeSH terms
Substances
Grants and funding
- R01 AI024137/AI/NIAID NIH HHS/United States
- HHMI/Howard Hughes Medical Institute/United States
- AI024137/AI/NIAID NIH HHS/United States
- AI059575/AI/NIAID NIH HHS/United States
- R01 AI059575/AI/NIAID NIH HHS/United States
LinkOut - more resources
Full Text Sources
Other Literature Sources
Molecular Biology Databases
Research Materials


