The influenza virus M2 protein cytoplasmic tail interacts with the M1 protein and influences virus assembly at the site of virus budding - PubMed (original) (raw)
The influenza virus M2 protein cytoplasmic tail interacts with the M1 protein and influences virus assembly at the site of virus budding
Benjamin J Chen et al. J Virol. 2008 Oct.
Abstract
The cytoplasmic tail of the influenza A virus M2 proton-selective ion channel has been shown to be important for virus replication. Previous analysis of M2 cytoplasmic tail truncation mutants demonstrated a defect in incorporation of viral RNA (vRNA) into virions, suggesting a role for M2 in the recruitment of M1-vRNA complexes. To further characterize the effect of the M2 cytoplasmic tail mutations on virus assembly and budding, we constructed a series of alanine substitution mutants of M2 with mutations in the cytoplasmic tail, from residues 71 to 97. Mutant proteins M2-Mut1 and M2-Mut2, with mutations of residues 71 to 73 and 74 to 76, respectively, appeared to have the greatest effect on virus-like particle and virus budding, showing a defect in M1 incorporation. Mutant viruses containing M2-Mut1 and M2-Mut2 failed to replicate in multistep growth analyses on wild-type (wt) MDCK cells and were able to form plaques only on MDCK cells stably expressing wt M2 protein. Compared to wt M2 protein, M2-Mut1 and M2-Mut2 were unable to efficiently coimmunoprecipitate with M1. Furthermore, statistical analysis of planar sheets of membrane from cells infected by virus containing M2-Mut1 revealed a reduction in M1-hemagglutinin (HA) and M2-HA clustering as well as a severe loss of clustering between M1 and M2. These results suggest an essential, direct interaction between the cytoplasmic tail of M2 and M1 that promotes the recruitment of the internal viral proteins and vRNA to the plasma membrane for efficient virus assembly to occur.
Figures
FIG. 1.
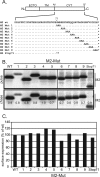
Influenza virus Ud M2 cytoplasmic tail mutants. (A) The amino acid sequence of the Ud M2 cytoplasmic tail (CYT) is shown. Nomenclature and amino acid changes in the M2 mutants created by alanine-scanning mutagenesis that were used in this study are listed below the wt M2 cytoplasmic tail sequence. Amino acid residues that are the same as those of the wt are indicated by periods, and asterisks indicates the M2 stop codons. ECTO, ectodomain; TM, transmembrane domain. (B) The stabilities of the mutant M2 proteins were tested by pulse-chase analysis. 293T cells were transfected with protein expression plasmids encoding wt M2 or the mutant M2 proteins. At 20 h p.t., the cells were metabolically labeled with [35S]methionine and [35S]cysteine. Cells were then lysed (pulse samples) or incubated in nonradioactive medium for 2 h and then lysed (chase samples). M2 protein in the cell lysate was immunoprecipitated with 14C2 MAb and analyzed by SDS-PAGE. Radiolabeled M2 proteins were detected by using a Fujifilm FLA-5100 system, and the ratio of the amount of protein in the chase sample to the amount of protein in the pulse sample was calculated by using MultiGauge software. (C) The surface expression levels of the mutant M2 proteins were determined by flow cytometry. Transfected 293T cells were labeled with MAb 14C2 followed by a fluorescein isothiocyanate-conjugated secondary antibody. Labeled cells were detected by flow cytometry, and the mean fluorescence intensity of cells expressing mutant M2 proteins was normalized to the mean fluorescence intensity of cells expressing wt M2.
FIG. 2.
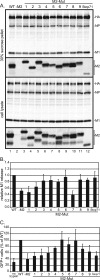
Release and infectivity of VLPs containing mutant M2 proteins. (A) VLPs were prepared with transfected 293T cells as described in Materials and Methods. As indicated, an M2 protein expression plasmid was omitted from the VLP preparation (−M2) or wt M2 expression plasmid was replaced with the indicated M2 mutant expression plasmid. The culture medium was harvested at 48 h p.t. and pelleted through a 30% sucrose cushion, and cell lysates were prepared as described in Materials and Methods. Samples were analyzed by SDS-PAGE on a 15% polyacrylamide gel followed by immunoblotting to detect viral proteins. (B) M1 protein in the 30% sucrose pellet was quantified by using the Odyssey infrared imaging system, and the value was normalized to the amount of M1 protein found in the cell lysate. The amount of M1 released from cells expressing all VLP proteins (WT) was set to 1.0. Error bars represent standard deviations from the averages for three experiments. (C) VLPs prepared as described above were harvested at 48 h p.t. and treated with trypsin. VLPs that were not treated with trypsin were used as a negative control. VLPs were transferred to target 293T cells expressing PB1, PB2, PA, and NP. Twenty-four hours later, the target cells were fixed, and GFP-positive cells were quantified by flow cytometry. The number of GFP-positive target cells overlaid with WT VLPs was set to 100%. Error bars represent standard deviations from the averages for three experiments.
FIG. 3.
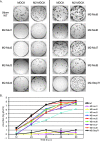
Plaque phenotype and replication of Ud M2 mutant viruses. (A) Ud influenza virus and mutant viruses containing M2 cytoplasmic tail mutations were generated by reverse genetics and assayed for plaque formation on MDCK and M2-MDCK cells. After 3 days of incubation, plaques were immunostained using goat anti-Ud serum followed by horseradish peroxidase-conjugated secondary antibody and metal-enhanced DAB substrate. All mutant viruses are Ud7+UdM1/M2 mutants. (B) MDCK cells were infected at an MOI of 0.001. At 12-h time points, an aliquot of the culture medium was removed, and virus titers were determined by plaque assay on M2-MDCK cells. Error bars represent standard deviations from the averages for three experiments.
FIG. 4.
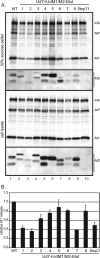
Assembly and release of Ud M2 mutant viruses. (A) MDCK cells were infected with wt Ud or Ud7+UdM1/M2 mutant virus at an MOI of 1 for 20 h. The culture medium was harvested, virions were pelleted through a 30% sucrose cushion, and cell lysates were prepared as described in Materials and Methods. Samples were analyzed by SDS-PAGE on a 15% polyacrylamide gel followed by immunoblotting to detect viral proteins. (B) M1 protein in the 30% sucrose pellet was quantified by using the Odyssey infrared imaging system and normalized to the amount of M1 protein found in the cell lysate. The amount of M1 released from cells infected by wt Ud was set to 1.0. Error bars represent standard deviations from the averages for three experiments.
FIG. 5.
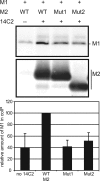
Coimmunoprecipitation (coIP) of M1 and mutant M2 proteins. 293T cells were transfected with plasmids expressing Ud M1 and wt M2, M2-Mut1, or M2-Mut2. Cells were lysed and M1-M2 complexes were coimmunoprecipitated by using MAb 14C2. Samples were analyzed by SDS-PAGE on a 17.5% polyacrylamide gel with 4 M urea followed by immunoblotting to detect M1 and M2. The amount of M1 detected was quantified by using the Odyssey infrared imaging system and normalized to the amount of M1 pulled down by wt M2 in the presence of MAb 14C2. Error bars represent standard deviations from the averages for three experiments.
FIG. 6.
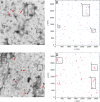
Distributions of M2 and M1 in membranes of virus-infected cells. Planar sheets of plasma membrane stained for viral proteins were prepared from infected MDCK cells as described in Materials and Methods. A portion of membrane sheet stained for M1 and M2, visualized with 12-nm and 6-nm gold particles, respectively, is shown for MDCK cells infected with wt Ud (A) or Ud7+UdM1/M2-Mut1 (C). Clathrin-coated pits are indicated by red arrows. Areas of clustering identified by visual inspection are outlined by boxes. Bar, 0.5 μm. Images of membrane sheets for which the thresholds had been determined were obtained, and an x/y coordinate list of all gold particles was generated. Graphic representations of the coordinate maps corresponding to panels A and C are shown in panels B and D, in which the locations of M1 are in blue and those of M2 are in red. Boxes indicate areas of clustering.
FIG. 7.
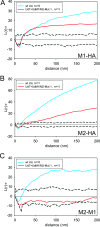
Statistical analysis of M2, M1, and HA clustering. The relative distributions of M1 and HA (A), M2 and HA (B), or M2 and M1 (C) were analyzed with the bivariate Ripley function, and these distributions for wt Ud (blue) and Ud7+UdM1/M2-Mut1 (red) were compared. The slight initial drop in the data for distances 10 nm and below is likely due to an artifact of antibody binding. The solid, black line represents a bivariate Ripley K function with a theoretical value of 0. The dashed lines represent the 99% confidence interval defining complete spatial randomness. The data that fall above the envelope are considered to represent coclustering, the magnitude of colocalization being proportional to the height of the line. When data fall within the envelope, the two protein populations are said to be distributed randomly with respect to one another.
Similar articles
- Mutations in the Influenza A Virus M1 Protein Enhance Virus Budding To Complement Lethal Mutations in the M2 Cytoplasmic Tail.
Liu H, Grantham ML, Pekosz A. Liu H, et al. J Virol. 2017 Dec 14;92(1):e00858-17. doi: 10.1128/JVI.00858-17. Print 2018 Jan 1. J Virol. 2017. PMID: 29046451 Free PMC article. - Lateral Organization of Influenza Virus Proteins in the Budozone Region of the Plasma Membrane.
Leser GP, Lamb RA. Leser GP, et al. J Virol. 2017 Apr 13;91(9):e02104-16. doi: 10.1128/JVI.02104-16. Print 2017 May 1. J Virol. 2017. PMID: 28202765 Free PMC article. - Assembly and budding of influenza virus.
Nayak DP, Hui EK, Barman S. Nayak DP, et al. Virus Res. 2004 Dec;106(2):147-65. doi: 10.1016/j.virusres.2004.08.012. Virus Res. 2004. PMID: 15567494 Free PMC article. Review. - Influenza virus assembly and budding.
Rossman JS, Lamb RA. Rossman JS, et al. Virology. 2011 Mar 15;411(2):229-36. doi: 10.1016/j.virol.2010.12.003. Epub 2011 Jan 14. Virology. 2011. PMID: 21237476 Free PMC article. Review.
Cited by
- Human annexin A6 interacts with influenza a virus protein M2 and negatively modulates infection.
Ma H, Kien F, Manière M, Zhang Y, Lagarde N, Tse KS, Poon LL, Nal B. Ma H, et al. J Virol. 2012 Feb;86(3):1789-801. doi: 10.1128/JVI.06003-11. Epub 2011 Nov 23. J Virol. 2012. PMID: 22114333 Free PMC article. - Quantitative analysis of the lipidomes of the influenza virus envelope and MDCK cell apical membrane.
Gerl MJ, Sampaio JL, Urban S, Kalvodova L, Verbavatz JM, Binnington B, Lindemann D, Lingwood CA, Shevchenko A, Schroeder C, Simons K. Gerl MJ, et al. J Cell Biol. 2012 Jan 23;196(2):213-21. doi: 10.1083/jcb.201108175. Epub 2012 Jan 16. J Cell Biol. 2012. PMID: 22249292 Free PMC article. - Filamentous influenza viruses.
Dadonaite B, Vijayakrishnan S, Fodor E, Bhella D, Hutchinson EC. Dadonaite B, et al. J Gen Virol. 2016 Aug;97(8):1755-1764. doi: 10.1099/jgv.0.000535. Epub 2016 Jun 30. J Gen Virol. 2016. PMID: 27365089 Free PMC article. Review. - Host-cell lipid rafts: a safe door for micro-organisms?
Vieira FS, Corrêa G, Einicker-Lamas M, Coutinho-Silva R. Vieira FS, et al. Biol Cell. 2010 Apr 6;102(7):391-407. doi: 10.1042/BC20090138. Biol Cell. 2010. PMID: 20377525 Free PMC article. Review. - Temperature Sensitive Mutations in Influenza A Viral Ribonucleoprotein Complex Responsible for the Attenuation of the Live Attenuated Influenza Vaccine.
Martínez-Sobrido L, Peersen O, Nogales A. Martínez-Sobrido L, et al. Viruses. 2018 Oct 15;10(10):560. doi: 10.3390/v10100560. Viruses. 2018. PMID: 30326610 Free PMC article. Review.
References
- Baddeley, A., and R. Turner. 2005. spatstat: an R package for analyzing spatial point patterns. J. Stat. Soft. 121-42.
Publication types
MeSH terms
Substances
Grants and funding
- R01 AI020201/AI/NIAID NIH HHS/United States
- HHMI/Howard Hughes Medical Institute/United States
- T32 GM08152-18/GM/NIGMS NIH HHS/United States
- T32 GM008152/GM/NIGMS NIH HHS/United States
- R01 AI-20201/AI/NIAID NIH HHS/United States
LinkOut - more resources
Full Text Sources
