Three SRA-domain methylcytosine-binding proteins cooperate to maintain global CpG methylation and epigenetic silencing in Arabidopsis - PubMed (original) (raw)
Three SRA-domain methylcytosine-binding proteins cooperate to maintain global CpG methylation and epigenetic silencing in Arabidopsis
Hye Ryun Woo et al. PLoS Genet. 2008.
Abstract
Methylcytosine-binding proteins decipher the epigenetic information encoded by DNA methylation and provide a link between DNA methylation, modification of chromatin structure, and gene silencing. VARIANT IN METHYLATION 1 (VIM1) encodes an SRA (SET- and RING-associated) domain methylcytosine-binding protein in Arabidopsis thaliana, and loss of VIM1 function causes centromere DNA hypomethylation and centromeric heterochromatin decondensation in interphase. In the Arabidopsis genome, there are five VIM genes that share very high sequence similarity and encode proteins containing a PHD domain, two RING domains, and an SRA domain. To gain further insight into the function and potential redundancy among the VIM proteins, we investigated strains combining different vim mutations and transgenic vim knock-down lines that down-regulate multiple VIM family genes. The vim1 vim3 double mutant and the transgenic vim knock-down lines showed decreased DNA methylation primarily at CpG sites in genic regions, as well as repeated sequences in heterochromatic regions. In addition, transcriptional silencing was released in these plants at most heterochromatin regions examined. Interestingly, the vim1 vim3 mutant and vim knock-down lines gained ectopic CpHpH methylation in the 5S rRNA genes against a background of CpG hypomethylation. The vim1 vim2 vim3 triple mutant displayed abnormal morphological phenotypes including late flowering, which is associated with DNA hypomethylation of the 5' region of FWA and release of FWA gene silencing. Our findings demonstrate that VIM1, VIM2, and VIM3 have overlapping functions in maintenance of global CpG methylation and epigenetic transcriptional silencing.
Conflict of interest statement
The authors have declared that no competing interests exist.
Figures
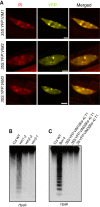
Figure 1. DNA methylation of the centromeric repeats in vim mutants.
(A) Subnuclear localization of VIM proteins. Localization of VIM proteins were detected in Col root nuclei expressing a YFP-VIM1, YFP-VIM2, or YFP-VIM3 transgene under the control of the 35S promoter. Propidium iodide (PI) was used as a DNA counterstain; chromocenters are more intensely stained. Bar, 5 µm. (B) 180-bp centromeric repeat methylation phenotype in different vim single mutants. (C) Suppression of centromere DNA hypomethylation phenotype in the Bor-4 strain, which contains the natural vim1-1 allele, by overexpressing VIM cDNA clones. Bor-4 plants were transformed with VIM1, VIM2, or VIM3 transgene under the control of the 35S promoter. Genomic DNA samples of the indicated genotypes were digested with _Hpa_II and used for DNA gel blot analysis with a probe for the 180-bp centromere repeats.
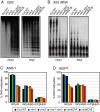
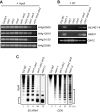
Figure 2. DNA methylation at heterochromatic loci is affected in the vim1 vim3 mutant and the vim knock-down lines.
(A, B) DNA methylation was determined by DNA gel blot analysis; genomic DNA was digested with _Hpa_II or _Msp_I and blots were hybridized with probes corresponding to 180-bp centromeric repeats (A) and 45S rRNA (B). (C, D) DNA methylation for AtMU1 (C) and AtGP1 (D) was analyzed by bisulfite sequencing. Histograms represent the percentage of CpG, CpHpG, and CpHpH methylation in the indicated genotypes.
Figure 3. DNA methylation patterns at 5S rRNA genes.
(A) DNA methylation was determined by DNA gel blot analysis with genomic DNA samples; genomic DNA digested with _Hpa_II, _Msp_I, or _Hae_III was hybridized to a 5S rRNA probe. (B) Analysis of DNA methylation by bisulfite sequencing. Histograms represent the percentage of CpG, CpHpG, and CpHpH methylation in the indicated genotypes. (C) Detailed DNA methylation profile for 5S rRNA gene in Col (top) and _vim_KD-B (bottom). The percentages of methylation of each cytosine residue were calculated. The x-axis represents cytosine positions in the analyzed region, and the y-axis represents methylation levels in each genotype. The black bar in the middle shows a coding region of 5S rRNA gene. CpG, CpHpG, and CpHpH methylation are indicated by blue, green, and red bars, respectively. (D) ROS1 mRNA accumulation was determined by RT-PCR. Total RNA from 3-week-old leaves of the indicated plant genotypes, and then RT-PCR was carried. First-strand cDNA synthesis was carried out with or without RT; we did not detect transcripts from the ‘minus RT’ samples. Amplification of GAPC (glyceraldehyde-3-phosphate dehydrogenase) was used to normalize RNA template amounts.
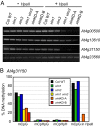
Figure 4. Genic DNA methylation is decreased only at CpG in the vim1 vim3 mutant and the vim knockdown lines.
(A) DNA methylation analysis by _Hpa_II-PCR. _Hpa_II-digested genomic DNA was amplified by PCR with primers for the indicated genes. Undigested DNA (- _Hpa_II) and a gene lacking _Hpa_II sites (At4g23560) served as PCR controls. (B) Analysis of DNA methylation at At4g31150 by bisulfite sequencing. Histograms represent the percentage of methylation of CpG, CpHpG, CpHpH, and CpG methylation at the _Hpa_II site tested in (A).
Figure 5. Release of transcriptional silencing at heterochromatic regions in the vim1 vim3 mutant and the vim knockdown lines.
(A) Transcripts from the 180-bp centromeric repeats. RT was performed with the primers indicated to the top of the panel (cDNA synthesis primers), followed by PCR using the amplification primers. GAPC was used as a control. (-), no primers; GAPC-R, GAPC reverse primer; CEN-F, centromere forward primer; CEN-R, centromere reverse primer. (B) RT-PCR detection of 5S-210 and 5S-140 transcript levels. RT was performed with GAPC-R and 5S rRNA reverse primer with or without RT followed by PCR with the first primer and a corresponding primer on the other strand. First-strand cDNA synthesis was carried out with or without RT; we did not detect transcripts from the ‘minus RT’ samples. (C) Transcription analysis of various transposons. RT-PCR was carried out using RNA samples from the indicated genotypes. First-strand cDNA synthesis was carried out with or without RT; we did not detect transcripts from the ‘minus RT’ samples. Amplification of ACT2 (Actin2) was used to normalize RNA template amounts.
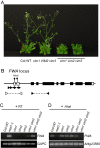
Figure 6. Loss of FWA silencing in the vim1 vim2 vim3 triple mutant.
(A) Delayed flowering of vim1 vim2 vim3 mutant plants. A vim1/vim1 vim2/+vim3/vim3 parent was self-pollinated to generate a segregating family and triple mutants were compared to vim1 VIM2 vim3 siblings (VIM2 stands for +/+ or vim2/+), which were indistinguishable from wild-type Col plants (Col WT) with respect to flowering time and overall morphology. Image of 30-day old plants grown under long-day conditions. (B) FWA gene structure. Solid rectangles, translated exons; open rectangles, untranslated exons; arrowheads and arrows, direct repeats; triangles, primers used to amplify the 5′ region of FWA or FWA coding sequences. (C) Ectopic expression of FWA in rosette leaves of the met1-1, vim1 vim3, and vim1 vim2 vim3 mutants. FWA transcripts were examined by RT-PCR and the constitutively expressed GAPC served as a control. First-strand cDNA synthesis was carried out with or without RT; we did not detect transcripts from the ‘minus RT’ samples. (D) DNA methylation of the FWA upstream region. Genomic DNA was digested with _Hha_I; subsequently, the tandem repeats in the 5′ region of FWA were amplified by PCR. A gene lacking _Hha_I sites (At4g23560) served as a PCR control.
Figure 7. DNA hypomethylation and transcriptional reactivation in the vim1 vim2 vim3 mutant.
(A) Genic DNA methylation in vim mutants. DNA methylation was analyzed by _Hpa_II-PCR. _Hpa_II-digested genomic DNA was amplified by PCR with primers for the indicated genes. A gene lacking _Hpa_II sites (At4g23560) served as PCR controls. (B) Release of transcriptional silencing of transposons. RT-PCR was carried out using RNA samples from the indicated genotypes. First-strand cDNA synthesis was carried out with or without RT; we did not detect transcripts from the ‘minus RT’ samples. Amplification of GAPC was used to normalize RNA template amounts. (C) DNA methylation in 5S rRNA genes and the 180-bp centromeric repeats (CEN) in vim and met1 mutants. DNA methylation was monitored by DNA gel blot analysis; genomic DNA was digested with _Hpa_II and the blot was hybridized sequentially with radiolabeled probes corresponding to 5S rRNA (left) and the 180-bp centromeric repeats (right). More genomic DNA for the met1-3 mutant was loaded on the gel, so a matched exposure is shown for this sample as a separate box. The numbers shown below the each panel indicate the percentage of hybridization signal present in the bottom band for 5S rRNA genes (denoted by bracket on the left) and in the lower 8 bands for the 180-bp centromere repeats (denoted by bracket on the right).
Similar articles
- Arabidopsis VIM proteins regulate epigenetic silencing by modulating DNA methylation and histone modification in cooperation with MET1.
Kim J, Kim JH, Richards EJ, Chung KM, Woo HR. Kim J, et al. Mol Plant. 2014 Sep;7(9):1470-1485. doi: 10.1093/mp/ssu079. Epub 2014 Jul 9. Mol Plant. 2014. PMID: 25009302 Free PMC article. - VIM proteins regulate transcription exclusively through the MET1 cytosine methylation pathway.
Shook MS, Richards EJ. Shook MS, et al. Epigenetics. 2014 Jul;9(7):980-6. doi: 10.4161/epi.28906. Epub 2014 Apr 24. Epigenetics. 2014. PMID: 24762702 Free PMC article. - ORTH/VIM proteins that regulate DNA methylation are functional ubiquitin E3 ligases.
Kraft E, Bostick M, Jacobsen SE, Callis J. Kraft E, et al. Plant J. 2008 Dec;56(5):704-15. doi: 10.1111/j.1365-313X.2008.03631.x. Epub 2008 Sep 19. Plant J. 2008. PMID: 18643997 Free PMC article. - Heterochromatin dynamics during developmental transitions in Arabidopsis - a focus on ribosomal DNA loci.
Benoit M, Layat E, Tourmente S, Probst AV. Benoit M, et al. Gene. 2013 Aug 15;526(1):39-45. doi: 10.1016/j.gene.2013.01.060. Epub 2013 Feb 12. Gene. 2013. PMID: 23410919 Review. - Transcription of the 5S rRNA heterochromatic genes is epigenetically controlled in Arabidopsis thaliana and Xenopus laevis.
Douet J, Tourmente S. Douet J, et al. Heredity (Edinb). 2007 Jul;99(1):5-13. doi: 10.1038/sj.hdy.6800964. Epub 2007 May 9. Heredity (Edinb). 2007. PMID: 17487217 Review.
Cited by
- Epigenetic gene regulation in plants and its potential applications in crop improvement.
Zhang H, Zhu JK. Zhang H, et al. Nat Rev Mol Cell Biol. 2025 Jan;26(1):51-67. doi: 10.1038/s41580-024-00769-1. Epub 2024 Aug 27. Nat Rev Mol Cell Biol. 2025. PMID: 39192154 Review. - Molecular and structural basis of the chromatin remodeling activity by Arabidopsis DDM1.
Osakabe A, Takizawa Y, Horikoshi N, Hatazawa S, Negishi L, Sato S, Berger F, Kakutani T, Kurumizaka H. Osakabe A, et al. Nat Commun. 2024 Jul 11;15(1):5187. doi: 10.1038/s41467-024-49465-w. Nat Commun. 2024. PMID: 38992002 Free PMC article. - GhVIM28, a negative regulator identified from VIM family genes, positively responds to salt stress in cotton.
Yang Z, Lu X, Wang N, Mei Z, Fan Y, Zhang M, Wang L, Sun Y, Chen X, Huang H, Meng Y, Liu M, Han M, Chen W, Zhang X, Yu X, Chen X, Wang S, Wang J, Zhao L, Guo L, Peng F, Feng K, Gao W, Ye W. Yang Z, et al. BMC Plant Biol. 2024 May 21;24(1):432. doi: 10.1186/s12870-024-05156-8. BMC Plant Biol. 2024. PMID: 38773389 Free PMC article. - The Ralstonia pseudosolanacearum Type III Effector RipL Delays Flowering and Promotes Susceptibility to Pseudomonas syringae in Arabidopsis thaliana.
Kim W, Jeon H, Lee H, Sohn KH, Segonzac C. Kim W, et al. Mol Cells. 2023 Nov 30;46(11):710-724. doi: 10.14348/molcells.2023.0127. Epub 2023 Nov 14. Mol Cells. 2023. PMID: 37968984 Free PMC article. - Chromatin remodeling of histone H3 variants by DDM1 underlies epigenetic inheritance of DNA methylation.
Lee SC, Adams DW, Ipsaro JJ, Cahn J, Lynn J, Kim HS, Berube B, Major V, Calarco JP, LeBlanc C, Bhattacharjee S, Ramu U, Grimanelli D, Jacob Y, Voigt P, Joshua-Tor L, Martienssen RA. Lee SC, et al. Cell. 2023 Sep 14;186(19):4100-4116.e15. doi: 10.1016/j.cell.2023.08.001. Epub 2023 Aug 28. Cell. 2023. PMID: 37643610 Free PMC article.
References
- Bender J. DNA methylation and epigenetics. Annu Rev Plant Biol. 2004;55:41–68. - PubMed
- Goll MG, Bestor TH. Eukaryotic cytosine methyltransferases. Annu Rev Biochem. 2005;74:481–514. - PubMed
- Klose RJ, Bird AP. Genomic DNA methylation: the mark and its mediators. Trends Biochem Sci. 2006;31:89–97. - PubMed
- Chan SW, Henderson IR, Jacobsen SE. Gardening the genome: DNA methylation in Arabidopsis thaliana. Nat Rev Genet. 2005;6:351–360. - PubMed
Publication types
MeSH terms
Substances
LinkOut - more resources
Full Text Sources
Other Literature Sources
Molecular Biology Databases
Miscellaneous
