T cells' immunological synapses induce polarization of brain astrocytes in vivo and in vitro: a novel astrocyte response mechanism to cellular injury - PubMed (original) (raw)
T cells' immunological synapses induce polarization of brain astrocytes in vivo and in vitro: a novel astrocyte response mechanism to cellular injury
Carlos Barcia et al. PLoS One. 2008.
Abstract
Background: Astrocytes usually respond to trauma, stroke, or neurodegeneration by undergoing cellular hypertrophy, yet, their response to a specific immune attack by T cells is poorly understood. Effector T cells establish specific contacts with target cells, known as immunological synapses, during clearance of virally infected cells from the brain. Immunological synapses mediate intercellular communication between T cells and target cells, both in vitro and in vivo. How target virally infected astrocytes respond to the formation of immunological synapses established by effector T cells is unknown.
Findings: Herein we demonstrate that, as a consequence of T cell attack, infected astrocytes undergo dramatic morphological changes. From normally multipolar cells, they become unipolar, extending a major protrusion towards the immunological synapse formed by the effector T cells, and withdrawing most of their finer processes. Thus, target astrocytes become polarized towards the contacting T cells. The MTOC, the organizer of cell polarity, is localized to the base of the protrusion, and Golgi stacks are distributed throughout the protrusion, reaching distally towards the immunological synapse. Thus, rather than causing astrocyte hypertrophy, antiviral T cells cause a major structural reorganization of target virally infected astrocytes.
Conclusions: Astrocyte polarization, as opposed to hypertrophy, in response to T cell attack may be due to T cells providing a very focused attack, and thus, astrocytes responding in a polarized manner. A similar polarization of Golgi stacks towards contacting T cells was also detected using an in vitro allogeneic model. Thus, different T cells are able to induce polarization of target astrocytes. Polarization of target astrocytes in response to immunological synapses may play an important role in regulating the outcome of the response of astrocytes to attacking effector T cells, whether during antiviral (e.g. infected during HIV, HTLV-1, HSV-1 or LCMV infection), anti-transplant, autoimmune, or anti-tumor immune responses in vivo and in vitro.
Conflict of interest statement
Competing Interests: The authors have declared that no competing interests exist.
Figures
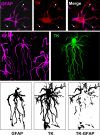
Figure 1. Immunocytochemistry for TK reveals the full extent of infected astrocyte morphology compared to GFAP.
Confocal images show double staining of TK and GFAP in rat brain sections. The top row shows that TK and GFAP stain different structures and processes of the same cell. Arrows indicate processes that are TK+ but not GFAP+. The middle row shows a TK+ cell which is also GFAP+. Note that TK staining reveals more processes, and a fuller cell body than GFAP. In the lower row we show the optical segmentation of TK, GFAP and the non-overlapping area (GFAP image subtracted from TK image). The result shows the TK+ processes that are not GFAP+. This demonstrates that TK provides a fuller image of infected astrocytes.
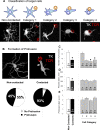
Figure 2. Virally infected astrocytes display a different phenotype when contacted by T cells.
Astrocytes contacted by infiltrating T cells display various alterations in morphology in comparison with cells not contacted. According to the degree of morphological alteration, the morphologies of contacted cells were further classified into the four categories illustrated in (A). In (A) target astrocytes are represented as blue stellate shapes, while contacting T cells are represented as round yellow shapes. The confocal micrographs illustrate Category 1–4 infected target cells immunolabeled for TK (white) and T cells immunolabeled for TCR (red).
Category 1
includes virally infected cells (i.e., expressing TK) with T cells contacting regular processes (<2 μm in diameter);
Category 2
includes virally infected cells with T cells contacting a protrusion (a cell process >2.5 μm in diameter);
Category 3
includes virally infected cells with T cells in contact with the cell body with obvious cytoplasm between the cells; and
Category 4
includes virally infected cells with T cells in contact with the cell body without obvious cytoplasm between the two cells. (B) shows confocal images of virally infected cells (TK, white) either contacted by T cells (right panel, TCR, red), or non-contacted (left panel). A significantly higher proportion of virally infected, contacted cells displayed protrusions (93%) when compared to virally infected but non-contacted cells (45%) (p<0.05, Chi square test); white arrows indicate a branching protrusion in a non-contacted astrocyte in the left panel, and an astrocyte protrusion contacting a T cells in the right panel. (C) shows the number of processes, (D) the diameter of the processes, and (E) the diameters of protrusions in virally infected cells, either contacted by T cells or non-contacted. The left histograms in (C) through (E) compare contacted versus non-contacted cells; 1–4 are categories as described in (A). Numbers and percentages of cells in each category are indicated inside each bar. Note that the number of processes and their diameters are significantly reduced in contacted cells (* p<0.05; Student's t test). The reduction in process number is evident in categories 2 and higher (C, * p<0.05 v. Category 1; one way ANOVA), while the reduction in process diameter is seen in all categories of contacted cell.
Figure 3. The Golgi apparatus of infected brain cells is polarized towards the T cell in immunized animals.
Representative confocal images of infected brain cells and brain-infiltrating T cells are shown. Immunocytochemistry was performed with markers for cis-Golgi apparatus (green, GM130), T cells (red, TCR), virally infected brain cells (white, TK), and nuclei (blue, DAPI). MERGE 1 and MERGE 2 show the spatial relationship between the Golgi apparatus of virally infected cells and the contacting T cells. Note that the Golgi apparatus in non-contacted cells (Column 1) is perinuclear, and does not appear to enter astrocyte processes. The Golgi apparatus of Category 2 cells (Column 2) is hypertrophic, localized inside the protrusion, and polarized towards the T cell. Column 3 shows a Category 3 cell with hypertrophic Golgi apparatus polarized towards the T cell. The Golgi apparatus of a Category 4 cell (Column 4) is condensed to an area adjacent to the T cell.
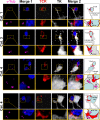
Figure 4. The MTOC of infected brain cells is polarized to the T cell.
Representative confocal images of four contacts between astrocytes and T cells. Cells were labeled with markers for MTOC (γ-Tubulin, magenta), viral infection (TK, white), and T cells (TCR, red); and nuclei are stained with DAPI (blue), using immunofluorescent techniques. MERGE 1 is a composite image showing nuclear staining and MTOC. MERGE 2 shows MTOC, virally infected cells, T cells, and nuclei. A magnification of the contact zone is shown below each panel. The right hand column contains drawings of the MERGE 2 images, indicating the spatial relationship between the MTOC (magenta) of the virally infected cells (grey), and the T cells (red). The first row shows a cell of Category 1. The MTOC is localized in a process of the infected cell. The MTOC of the T cell is facing the MTOC of the infected cell. TCR also is polarized towards the infected process. The second row of images represents a cell of Category 3, with MTOC and TCR polarized towards the T cell. The third row shows a cell of Category 4, also with MTOC polarized to the T cell but positioned to one side of the T-astrocyte interface; notice that this astrocyte appears to have multiple MTOC-like structures. Also the MTOC of the T cell is polarized to the MTOC of the infected cell. The bottom row shows another Category 4 cell immunological synaptic junction.
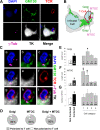
Figure 5. Intracellular distributions of the Golgi apparatus and MTOC are altered in infected brain cells contacted by T cells.
A. Confocal images of an infected cell contacted by a T cell, immunofluorescently labeled with markers for MTOC (γ-Tubulin, magenta), Golgi apparatus (GM130, green), viral infection (TK, white), T cells (TCR, red), and with nuclei stained with DAPI (blue). The Golgi apparatus and the MTOC of the virally infected cell are polarized towards the T cell, and the Golgi apparatus and MTOC from the T cell are polarized towards the virally infected cell. TCR displays a pattern typical of the c-SMAC, characteristic of Kupfer-type immunological synapses, and is polarized towards the infected cell. B is a drawing of the cell shown in A. C. Higher magnification images of the T cell contact zone shown in A. MTOC and Golgi apparatus of both cells are facing each other (a, c, d and g–i). The MTOC and the Golgi apparatus are localized in the same area. TCR fluorescence co-localizes with Golgi apparatus and MTOC in the T cell (a–i). D shows the percentage of virally infected brain cells with Golgi and/or MTOC polarized towards the T cell. More than 80% of infected astrocytes forming immunological synapses show evidence of Golgi and/or MTOC polarization. (E) shows results of quantification of length of Golgi apparatus; the left histogram shows that it is significantly longer in contacted than in non-contacted cells (*p<0.05, Student's t test). Among contacted cells, it is significantly longer in Category 2 cells compared to the other categories (*p<0.05, One-way ANOVA). (F) shows the distance of the MTOC from the nucleus of the infected cells, and reveals that this distance is larger in the contacted than in non-contacted cells (*p<0.05, Student's t test), and among contacted cells is larger in categories 1 and 2 than in 3 and 4 (ˆ* p<0.05 vs. Category 3, non-parametric Kruskal-Wallis test followed by Dunn's post-test; ˆ* p<0.05 vs. Category 4, non-parametric Kruskal-Wallis test followed by Dunn's post-test). (G) shows the number of MTOC found in the infected cells and suggests that this is greater in contacted than in non-contacted cells (*p<0.05, Student's t test).
Figure 6. The glutamate transporter GLT-1 is expressed in virally infected astrocytes.
Representative confocal images of brain sections stained with markers specific for activated astrocytes (GFAP, magenta), glutamate transporter (GLT-1, green), viral infection (TK, red), and nuclei (DAPI, blue). Merge 1 displays GFAP and GLT-1 immunoreactivity to show expression of GLT-1 in astrocytes; Merge 2 shows TK and GLT-1 immunoreactivity to indicate GLT-1 expression in virally infected cells; and Merge 3 depicts GFAP, GLT-1, and TK immunoreactivity to demonstrate expression of GLT-1 in virally infected astrocytes. White rectangles show a higher magnification of a triple-labeled process. Note that GLT-1 is expressed in astrocytes, and appears localized to the membrane surrounding GFAP filaments.
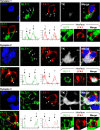
Figure 7. The glutamate transport protein GLT-1 is excluded from the astrocyte membrane area directly opposed to the c-SMAC zone of the Kupfer-type immunological synapse.
Confocal images of three Kupfer-type immunological synapses are shown. The top row for each synapse shows images of markers specific for nuclei (DAPI, blue), glutamate transporter (GLT-1, green), T cell adhesion protein (LFA-1, red), viral infection (TK, white), or the superposition of all four color channels (Merge). Bottom rows show fluorescence intensity graphs of GLT-1 and LFA-1 along the path indicated by the white arrow. 3-D reconstructions of the interface of the immunological synapse are shown on the right of the bottom rows with markers specific for GLT-1 and LFA-1. Note the characteristic peripheral distribution of LFA-1 on the T cell (p-SMAC) and a similar peripheral distribution of GLT-1 on the post-synaptic astrocyte. Fluorescence intensity graphs confirm a similar peripheral distribution pattern of LFA-1 and GLT-1. The peripheral area of the interface is indicated by arrows 1 and 3, and the center of the interface by arrow 2 in both confocal images and fluorescence intensity graphs.
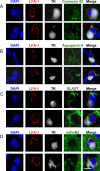
Figure 8. The distribution of other membrane proteins (Connexin 43, Aquaporin-4, GLAST, mGluR5) enriched within the plasma membrane of astrocytes show no obvious pattern of distribution in relation to the T cell immunological synapse.
Confocal 0.5 μm optical sections of two immunological synapses are shown stained for each of the membrane proteins. Staining for LFA-1 (red), TK (grey) and DAPI (blue) were combined either with Connexin 43 (green in A), Aquaporin-4 (green in B), GLAST (green in C) or mGluR5 (green in D). The superposition of all four channels is also shown for each synapse (Merge). There was no specific polarization of any of these membrane proteins. Scale bar = 10 μm.
Figure 9. MHC-I expression increases in infected astrocytes during an antiviral immune response, but does not show any particular pattern of distribution in relation to T cells' contacts.
(A) shows representative confocal images of non-contacted (top row) and contacted cells (bottom row) stained with DAPI (blue), and immunolabeled with markers of viral infection (TK, green), MHC-I (red), and activated astrocytes (GFAP, magenta). The fourth panel in each row shows an overlapping image of TK and MHC-I (TK MHC-1), of which the fifth panel is a higher magnification of the white boxed area. The last panel is a superposition of all four color channels (MERGE). MHC-I is expressed at high levels in virally infected astrocytes in contact with T cells. Note that presumed leukocytes (identified by the absence of TK, or GFAP immunoreactivity, ‘L’) display intense MHC-I immunofluorescence. Nuclei of virally infected astrocytes are indicated by (yellow) ‘A’. (B) shows the relative quantification of MHC-I fluorescence along protrusions (top panels) or processes (bottom panels) of contacted cells. Illustrations on the left indicate the morphological position of the measurements analyzed (with respect to the nucleus). Fluorescence intensity graphs in the center display relative MHC-I immunofluorescence (measured from the cell body to the cell periphery along the arrows indicated in the left panels). MHC-I intensity on both sides (M1 and M2) and cytoplasm (C) of virally infected cells is shown. Analysis of relative fluorescence on the right shows the average intensity of MHC-I expression in proximal, medial and distal areas, relative to the nucleus. The fluorescence intensity of 30 cells was measured. The expression of MHC-I follows a proximo-distal pattern of intensity.
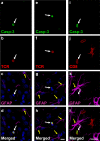
Figure 10. CD8+ T cells, but not infected astrocytes display caspase-3 activation following immunization.
Figure 10 illustrates the striatum from rats injected intracerebrally with Ad-TK and systemically immunized against adenovirus, and immunolabeled to detect potential apoptosis of infected cells. Tissue sections were labeled with antibodies that recognize activated caspase-3 (green), the T cell markers TCR or CD8 (red), the astrocyte marker GFAP (magenta), and DAPI (blue). Numerous GFAP-immunolabeled astrocytes (yellow arrows) and TCR+ or CD8+ T cells (white arrows) were examined; only T cells showed caspase-3 activation (white arrows). Scale bar (a–h; shown in h) = 10 μm; scale bar (i–l; shown in l) = 20 μm.
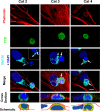
Figure 11. Immunological synapses between allogeneic T cells and Sprague-Dawley astrocytes in vitro: in T cells, the Golgi apparatus and T cell receptor polarize towards the target astrocytes, and in target astrocytes, the Golgi apparatus polarizes toward the immunological synapse.
This figure shows confocal images of primary cultured astrocytes from neonatal rat cortex derived from outbred Sprague Dawley rats interacting with allogeneic T cells from adult Lewis rats (last column), or outbred Sprague Dawley rats (columns 1 and 2); note that since Sprague Dawley rats are outbred cells from different individuals are allogeneic to each other. One such interaction is shown for each of categories 2, 3 and 4 (as described in Figure 2A for the in vivo interactions). Actin is labeled with phalloidin (red), and nuclei with DAPI (blue). TCR and GM130 are immunofluorescently labeled and shown in green and cyan, respectively. The Golgi apparatus of T cells is indicated by a full white arrow; the Golgi apparatus of the target astrocytes is indicated by a white arrow outline. The bottom three panels are vertical cross sections through the T cells, revealing that in the Category 2 interaction, the T cell is superficially apposed to the target, while in the Category 3 and 4 interactions, the T cell is deeply embedded in the target. In the Category 2 interaction, the Golgi body appears to be streaming into the process contacted by the T cell. In the Category 3 interaction, the Golgi is focused in the space between the two nuclei, and in the Category 4 interaction, the T cell is interposed between the nucleus and the Golgi apparatus of the target cell. In the third and fourth panel of each column the Golgi apparatus of the T cell is indicated with a white arrow (this indicates the location of the presumed immunological synapse; for the interaction illustrated for Category 2, the inset illustrates an optical section through the lower part of the T cell actually contacting the astrocyte–due to this anatomical arrangement, the Golgi apparatus appears to be surrounded by the T cell nucleus-). All categories of interaction were detected in the Lewis-Sprague Dawley or Sprague Dawley-Sprague Dawley combinations. In the majority of interactions in which the target Golgi displays the morphology depicted here, the T cell Golgi and the greatest accumulation of TCR immunofluorescence (i.e., the immunological synapse) are co-localized and in contact with the target cell; the TCR polarization can be seen clearest in the fifth panel (cross-section) of the left hand column, and the large accumulation of TCR immunoreactivity towards the intercellular contact seen in the fourth panel (merge) of the middle column. The sixth (bottom) panel of each column is a schematic rendition of the cross section shown in the fifth panel, to illustrate the close spatial relationship between the T cells and allogeneic astrocytes. Scale bar = 6 μm.
Similar articles
- In vivo polarization of IFN-gamma at Kupfer and non-Kupfer immunological synapses during the clearance of virally infected brain cells.
Barcia C, Wawrowsky K, Barrett RJ, Liu C, Castro MG, Lowenstein PR. Barcia C, et al. J Immunol. 2008 Feb 1;180(3):1344-52. doi: 10.4049/jimmunol.180.3.1344. J Immunol. 2008. PMID: 18209028 Free PMC article. - In vivo mature immunological synapses forming SMACs mediate clearance of virally infected astrocytes from the brain.
Barcia C, Thomas CE, Curtin JF, King GD, Wawrowsky K, Candolfi M, Xiong WD, Liu C, Kroeger K, Boyer O, Kupiec-Weglinski J, Klatzmann D, Castro MG, Lowenstein PR. Barcia C, et al. J Exp Med. 2006 Sep 4;203(9):2095-107. doi: 10.1084/jem.20060420. Epub 2006 Aug 21. J Exp Med. 2006. PMID: 16923851 Free PMC article. - Studying the T Cell-Astrocyte Immune Synapse.
Cribaro GP, Saavedra-López E, Casanova PV, Rodríguez L, Barcia C. Cribaro GP, et al. Methods Mol Biol. 2017;1584:517-531. doi: 10.1007/978-1-4939-6881-7_32. Methods Mol Biol. 2017. PMID: 28255723 - The MTOC/Golgi Complex at the T-Cell Immunological Synapse.
Roig-Martinez M, Saavedra-Lopez E, Casanova PV, Cribaro GP, Barcia C. Roig-Martinez M, et al. Results Probl Cell Differ. 2019;67:223-231. doi: 10.1007/978-3-030-23173-6_9. Results Probl Cell Differ. 2019. PMID: 31435797 Review. - The Astrocyte-Neuron Interface: An Overview on Molecular and Cellular Dynamics Controlling Formation and Maintenance of the Tripartite Synapse.
Hasan U, Singh SK. Hasan U, et al. Methods Mol Biol. 2019;1938:3-18. doi: 10.1007/978-1-4939-9068-9_1. Methods Mol Biol. 2019. PMID: 30617969 Review.
Cited by
- Antigen recognition is facilitated by invadosome-like protrusions formed by memory/effector T cells.
Sage PT, Varghese LM, Martinelli R, Sciuto TE, Kamei M, Dvorak AM, Springer TA, Sharpe AH, Carman CV. Sage PT, et al. J Immunol. 2012 Apr 15;188(8):3686-99. doi: 10.4049/jimmunol.1102594. Epub 2012 Mar 21. J Immunol. 2012. PMID: 22442443 Free PMC article. - The Neurotoxic Effect of Ochratoxin-A on the Hippocampal Neurogenic Niche of Adult Mouse Brain.
Mateo E, Tonino RPB, Canto A, Monroy Noyola A, Miranda M, Soria JM, Garcia Esparza MA. Mateo E, et al. Toxins (Basel). 2022 Sep 6;14(9):624. doi: 10.3390/toxins14090624. Toxins (Basel). 2022. PMID: 36136561 Free PMC article. - Spectrum of sublytic astrocytopathy in neuromyelitis optica.
Guo Y, Lennon VA, Parisi JE, Popescu B, Vasquez C, Pittock SJ, Howe CL, Lucchinetti CF. Guo Y, et al. Brain. 2022 May 24;145(4):1379-1390. doi: 10.1093/brain/awab394. Brain. 2022. PMID: 34718426 Free PMC article. - ICAM1+ neutrophils promote chronic inflammation via ASPRV1 in B cell-dependent autoimmune encephalomyelitis.
Whittaker Hawkins RF, Patenaude A, Dumas A, Jain R, Tesfagiorgis Y, Kerfoot S, Matsui T, Gunzer M, Poubelle PE, Larochelle C, Pelletier M, Vallières L. Whittaker Hawkins RF, et al. JCI Insight. 2017 Dec 7;2(23):e96882. doi: 10.1172/jci.insight.96882. JCI Insight. 2017. PMID: 29212956 Free PMC article. - Kupfer-type immunological synapse characteristics do not predict anti-brain tumor cytolytic T-cell function in vivo.
Yang J, Sanderson NS, Wawrowsky K, Puntel M, Castro MG, Lowenstein PR. Yang J, et al. Proc Natl Acad Sci U S A. 2010 Mar 9;107(10):4716-21. doi: 10.1073/pnas.0911587107. Epub 2010 Jan 19. Proc Natl Acad Sci U S A. 2010. PMID: 20133734 Free PMC article.
References
- Pascual O, Casper KB, Kubera C, Zhang J, Revilla-Sanchez R, et al. Astrocytic purinergic signaling coordinates synaptic networks. Science. 2005;310:113–116. - PubMed
- Haydon PG, Carmignoto G. Astrocyte control of synaptic transmission and neurovascular coupling. Physiol Rev. 2006;86:1009–1031. - PubMed
- Stevens B, Allen NJ, Vazquez LE, Howell GR, Christopherson KS, et al. The classical complement cascade mediates CNS synapse elimination. Cell. 2007;131:1164–1178. - PubMed
Publication types
MeSH terms
Substances
Grants and funding
- R01 NS054193-02/NS/NINDS NIH HHS/United States
- R01 NS061107-01A1/NS/NINDS NIH HHS/United States
- R21 NS047298-02/NS/NINDS NIH HHS/United States
- R21 NS047298/NS/NINDS NIH HHS/United States
- R01 NS044556/NS/NINDS NIH HHS/United States
- U54 NS045309/NS/NINDS NIH HHS/United States
- 1 R01 NS 054193.01/NS/NINDS NIH HHS/United States
- 1 R03 TW006273-01/TW/FIC NIH HHS/United States
- 1U01 NS052465.01/NS/NINDS NIH HHS/United States
- R01 NS054193-03/NS/NINDS NIH HHS/United States
- U54 NS045309-01/NS/NINDS NIH HHS/United States
- R01 NS054193/NS/NINDS NIH HHS/United States
- 1R01 NS44556.01/NS/NINDS NIH HHS/United States
- NS445561.01/NS/NINDS NIH HHS/United States
- U01 NS052465/NS/NINDS NIH HHS/United States
- 1 R01 NS06117-01/NS/NINDS NIH HHS/United States
- R01 NS061107/NS/NINDS NIH HHS/United States
- 1R21-NSO54143.01/PHS HHS/United States
- R01 NS054193-01A1/NS/NINDS NIH HHS/United States
- R01 NS 42893.01/NS/NINDS NIH HHS/United States
- R01 NS042893/NS/NINDS NIH HHS/United States
- 1R21 NS047298-01/NS/NINDS NIH HHS/United States
- R03 TW006273/TW/FIC NIH HHS/United States
LinkOut - more resources
Full Text Sources
