Differential migration, LPS-induced cytokine, chemokine, and NO expression in immortalized BV-2 and HAPI cell lines and primary microglial cultures - PubMed (original) (raw)
Differential migration, LPS-induced cytokine, chemokine, and NO expression in immortalized BV-2 and HAPI cell lines and primary microglial cultures
Ryan J Horvath et al. J Neurochem. 2008 Oct.
Abstract
Microglial cells are hematopoietically derived monocytes of the CNS and serve important neuromodulatory, neurotrophic, and neuroimmune roles. Following insult to the CNS, microglia develop a reactive phenotype, migrate to the site of injury, proliferate, and release a range of proinflammatory, anti-inflammatory, and neurotrophic factors. Isolation of primary microglial cell cultures has been an integral step in elucidating the many roles of these cells. In addition to primary microglial cells, several immortalized cell lines have been created to model primary microglia in vitro, including murine-derived BV-2 cells and rat derived highly aggressive proliferating immortalized (HAPI) cells. Here, we compare rat primary microglial, BV-2, and HAPI cells in experiments assessing migration, expression of activation markers, and production and release of nitric oxide, cytokines, and chemokines. BV-2 and HAPI cells responded similarly to primary microglia in experiments assessing migration, ionized calcium binding adaptor molecule 1 expression, and nitric oxide release. However, BV-2 and HAPI cells did not model primary microglia in experiments assessing tumor necrosis factor-alpha, interleukin-1beta, interleukin-6, and monocyte chemoattractant protein-1 expression and release and phospho-extracellular signal-regulated kinase 44/42 expression following lipopolysaccharide treatment. These results indicate that BV-2 and HAPI cell cultures only partially model primary microglia and that their use should therefore be carefully considered.
Figures
Figure 1
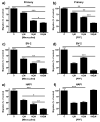
Minocycline and propentofylline inhibited migration in all three cell types. Primary microglial, BV-2 or HAPI cells were pretreated for 1 h with 0, 1, 10 or 100 μM minocycline or 0, 1, 10, or 100 μM propentofylline, then allowed to migrate towards 10 μM ADP for 2 h. (a) Minocycline (1, 10, 100 μM) dose dependently decreased migration of primary microglia towards ADP. (b) Primary microglial migration towards ADP was dose dependently inhibited by propentofylline (1, 10, 100 μM). (c) BV-2 cell migration towards ADP was dose dependently inhibited by minocycline (1, 10, 100 μM). (d) Propentofylline (1, 10, 100 μM) reduced BV-2 migration towards ADP, however, not in a dose dependent manner. (e) HAPI cell migration was dose dependently inhibited by minocycline (1, 10, 100 μM). (f) HAPI cell migration was reduced by 1 and 10 μM propentofylline, however, 100 μM had no effect. Results are shown as mean cell counts per 40x field as percentage of control ± SEM for all treatment groups. * p<0.05, ** p<0.01 and *** p<0.001.
Figure 2
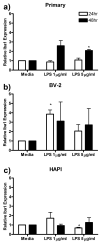
LPS enhanced Iba1 expression in primary microglia and BV-2 cells. Primary microglia, BV-2 or HAPI cells were treated with 0, 1 or 5 μg/ml LPS for 24 or 48 h. (a) Five μg/ml LPS enhanced primary microglial expression of Iba1 after 48 h treatment. (b) One μg/ml LPS enhanced BV-2 expression of Iba1 after 24h treatment. (c) Five μg/ml LPS decreased Iba1 expression in HAPI cells after 24 h treatment. Results are shown as mean Iba1 band immunoreactivity relative to β-actin and normalized to media controls ± SEM. * p<0.05 compared to media control.
Figure 3
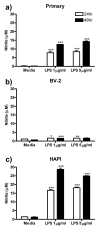
LPS treatment induced NO release from all three cell cultures. Primary microglia, BV-2 or HAPI cells were treated for 24 or 48 h with 0, 1 or 5 μg/ml LPS. (a) Primary microglia robustly increased NO release following treatment with LPS. (b) BV-2 cells slightly but significantly increased NO release following LPS treatment. (c) LPS treatment induced robust increases in NO release in HAPI cells. Results are expressed as mean nitrite (μM) ± SEM. * p<0.05, ** p<0.01 and *** p<0.001 compared to media control.
Figure 4
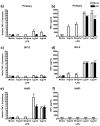
TNFα protein expression and release was increased in microglial cells following LPS treatment. Primary microglia, BV-2 or HAPI cells were treated with 0, 5 ng/ml, 50 ng/ml, 1 μg/ml or 5 μg/ml LPS for 24 h or 0, 1 or 5 μg/ml LPS for 48 h. (a) TNFα protein expression was enhanced in primary microglial cells following μg/ml LPS treatment. (b) Primary microglia robustly increased TNFα release following ng/ml and μg/ml LPS treatment. (c) TNFα expression was increased in BV-2 cells following μg/ml LPS for 24 h treatment and decreased after 48 h treatment. (d) LPS increased TNFα release in BV-2 cells after ng/ml and μg/ml treatment. (e) HAPI cells expression of TNFα protein was significantly increased after μg/ml LPS treatment, however, no released TNFα was observed these cells (f). Results from western blot experiments (a, c, e) are expressed as mean density of TNFα immunoreactivity relative to β-actin and normalized to media control ± SEM. Results from ELISA experiments (b, d, f) are shown as mean TNFα (pg/ml) ± SEM. ND, non-detectable. * p<0.05, ** p<0.01 and *** p<0.001 compared to media control.
Figure 5
LPS enhanced IL-1β protein expression and release in microglial cells. Primary microglia, BV-2 or HAPI cells were treated with 0, 5 ng/ml, 50 ng/ml, 1 μg/ml or 5 μg/ml LPS for 24 h or 0, 1 or 5 μg/ml LPS for 48 h. (a) Twenty-four and 48 h μg/ml LPS treatment enhanced pro-IL-1β (31kD) expression in primary cells. (b) No cleaved IL-1β (17kD) was observed in primary cells. (c) Primary microglia robustly released IL-1β following μg/ml LPS treatment. (d) LPS treatment did not alter IL-1β (31kD) expression in BV-2 cells. (e) BV-2 cells increased expression of IL-1β (17kD) after 24 h treatment with 1 μg/ml LPS. (f) LPS treatment did not alter IL-1β release from BV-2 cells. (g) HAPI cells did not alter expression of IL-1β (31kd) following LPS treatment. (h) HAPI cells increased expression of IL-1β (17kd) after 24 and 48 h μg/ml LPS treatment. (i) LPS treatment enhanced IL-1β release from HAPI cells following μg/ml LPS treatments. Results for western blot analysis (a, b, d, e, g, h) are shown as mean IL-1β immunoreactivity relative to β-actin and normalized to media control ± SEM. Results for ELISA experiments (c, f, i) are shown as IL-1β (pg/ml) ± SEM. ND, non-detectable. * p<0.05, ** p<0.01 and *** p<0.001 compared to media control.
Figure 6
LPS enhanced IL-6 expression and release in primary microglia and BV-2 cells. Primary microglia, BV-2 or HAPI cells were treated with 0, 5 ng/ml, 50 ng/ml, 1 μg/ml or 5 μg/ml LPS for 24 h or 0, 1 or 5 μg/ml LPS for 48 h. (a) LPS enhanced IL-6 expression in primary microglia after μg/ml treatment. (b) Primary microglial release of IL-6 was robustly increased by 24 and 48 h μg/ml LPS treatment. (c) No substantial changes in IL-6 protein were observed in BV-2 cells following LPS treatment. (d) BV-2 cells increased release of IL-6 following all LPS treatments. (e) No change in IL-6 protein was observed in HAPI cells following LPS treatment. (f) No IL-6 was observed in HAPI cell media following any treatment. Results for western blot (a, c, e) are expressed as mean IL-6 immunoreactivity relative to β-actin and normalized to media control ± SEM. Results for ELISA experiments (b, d, f) are expressed as mean IL-6 (pg/ml) ± SEM. ND, non-detectable. * p<0.05, ** p<0.01 and *** p<0.001 compared to media control.
Figure 7
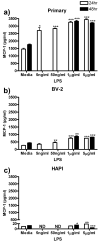
LPS induced MCP-1 release from primary, BV-2 and HAPI, but by very different amounts. Primary microglia, BV-2 and HAPI cells were treated for 24 h with 0, 5 ng/ml, 50 ng/ml, 1 μg/ml or 5 μg/ml LPS or for 48 h with 0, 1 or 5 μg/ml LPS. (a) Primary microglia enhanced release of MCP-1 following all LPS treatments. (b) LPS treatment enhanced MCP-1 release in BV-2 cells. (c) In HAPI cells, LPS treatment increased or decreased MCP-1 release to a small but significant extent. Results are expressed as mean MCP-1 (pg/ml) ± SEM. ND, non-detectable. * p<0.05, ** p<0.01 and *** p<0.001 compared to media control.
Figure 8
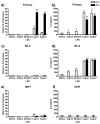
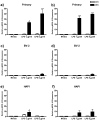
pERK 42 and pERK 44 expression is enhanced in primary microglia following LPS treatment. Primary microglia, BV-2 and HAPI cells were treated for 24 or 48 h with 0, 1 or 5 μg/ml LPS. (a) Treatment for 48 h with LPS enhanced pERK 44 expression in primary microglial cells. (b) pERK 42 expression was also enhanced in primary microglia following 48 h LPS treatment. (c) In BV-2 cells, LPS treatment did not alter pERK 44 (c) or pERK 42 (d) expression in BV-2 cells. In HAPI cells, 48 h treatment with 1 μg/ml LPS enhanced pERK 44 expression (e), however, there was no alteration in pERK 42 expression (f) for any treatment. Results are expressed as mean pERK immunoreactivity relative to total ERK and β-actin, then normalized to media controls ± SEM. * p<0.05 and *** p<0.001 compared to media control.
Similar articles
- Differential expression of chemokines and chemokine receptors during microglial activation and inhibition.
Kremlev SG, Roberts RL, Palmer C. Kremlev SG, et al. J Neuroimmunol. 2004 Apr;149(1-2):1-9. doi: 10.1016/j.jneuroim.2003.11.012. J Neuroimmunol. 2004. PMID: 15020059 - High yield primary microglial cultures using granulocyte macrophage-colony stimulating factor from embryonic murine cerebral cortical tissue.
Yu AC, Neil SE, Quandt JA. Yu AC, et al. J Neuroimmunol. 2017 Jun 15;307:53-62. doi: 10.1016/j.jneuroim.2017.03.018. Epub 2017 Apr 4. J Neuroimmunol. 2017. PMID: 28495139 - Pro-inflammatory cytokines and lipopolysaccharide induce changes in cell morphology, and upregulation of ERK1/2, iNOS and sPLA₂-IIA expression in astrocytes and microglia.
Sheng W, Zong Y, Mohammad A, Ajit D, Cui J, Han D, Hamilton JL, Simonyi A, Sun AY, Gu Z, Hong JS, Weisman GA, Sun GY. Sheng W, et al. J Neuroinflammation. 2011 Sep 24;8:121. doi: 10.1186/1742-2094-8-121. J Neuroinflammation. 2011. PMID: 21943492 Free PMC article. - Neuroprotection of Scutellarin is mediated by inhibition of microglial inflammatory activation.
Wang S, Wang H, Guo H, Kang L, Gao X, Hu L. Wang S, et al. Neuroscience. 2011 Jun 30;185:150-60. doi: 10.1016/j.neuroscience.2011.04.005. Epub 2011 Apr 19. Neuroscience. 2011. PMID: 21524691 - Systemic inflammation and microglial activation: systematic review of animal experiments.
Hoogland IC, Houbolt C, van Westerloo DJ, van Gool WA, van de Beek D. Hoogland IC, et al. J Neuroinflammation. 2015 Jun 6;12:114. doi: 10.1186/s12974-015-0332-6. J Neuroinflammation. 2015. PMID: 26048578 Free PMC article. Review.
Cited by
- Role for microglia in sex differences after ischemic stroke: importance of M2.
Bodhankar S, Lapato A, Chen Y, Vandenbark AA, Saugstad JA, Offner H. Bodhankar S, et al. Metab Brain Dis. 2015 Dec;30(6):1515-29. doi: 10.1007/s11011-015-9714-9. Epub 2015 Aug 6. Metab Brain Dis. 2015. PMID: 26246072 Free PMC article. - Gemfibrozil, a lipid lowering drug, inhibits the activation of primary human microglia via peroxisome proliferator-activated receptor β.
Jana M, Pahan K. Jana M, et al. Neurochem Res. 2012 Aug;37(8):1718-29. doi: 10.1007/s11064-012-0781-6. Epub 2012 Apr 17. Neurochem Res. 2012. PMID: 22528839 Free PMC article. - The Antineuroinflammatory Effect of Simvastatin on Lipopolysaccharide Activated Microglial Cells.
Zheng X, Liao Y, Wang J, Hu S, Rudramurthy GR, Swamy MK, Rohit KC, Wang Y. Zheng X, et al. Evid Based Complement Alternat Med. 2018 Nov 7;2018:9691085. doi: 10.1155/2018/9691085. eCollection 2018. Evid Based Complement Alternat Med. 2018. PMID: 30524484 Free PMC article. - In Vitro Methodologies to Study the Role of Advanced Glycation End Products (AGEs) in Neurodegeneration.
Chrysanthou M, Miro Estruch I, Rietjens IMCM, Wichers HJ, Hoppenbrouwers T. Chrysanthou M, et al. Nutrients. 2022 Jan 15;14(2):363. doi: 10.3390/nu14020363. Nutrients. 2022. PMID: 35057544 Free PMC article. Review.
References
- Bath PM, Bath-Hextall FJ.Pentoxifylline, propentofylline and pentifylline for acute ischaemic stroke Cochrane Database Syst Rev 2004, CD000162. - PubMed
- Blasi E, Barluzzi R, Bocchini V, Mazzolla R, Bistoni F. Immortalization of murine microglial cells by a v-raf/v-myc carrying retrovirus. J Neuroimmunol. 1990;27:229–237. - PubMed
- Blum D, Chtarto A, Tenenbaum L, Brotchi J, Levivier M. Clinical potential of minocycline for neurodegenerative disorders. Neurobiol Dis. 2004;17:359–366. - PubMed
- Boje KM, Arora PK. Microglial-produced nitric oxide and reactive nitrogen oxides mediate neuronal cell death. Brain Res. 1992;587:250–256. - PubMed
Publication types
MeSH terms
Substances
Grants and funding
- AR44757/AR/NIAMS NIH HHS/United States
- R01 AR044757/AR/NIAMS NIH HHS/United States
- R01 DA011276/DA/NIDA NIH HHS/United States
- T32 AI007363/AI/NIAID NIH HHS/United States
- T32 AI07363/AI/NIAID NIH HHS/United States
- DA11276/DA/NIDA NIH HHS/United States
LinkOut - more resources
Full Text Sources
Other Literature Sources
Molecular Biology Databases
Research Materials
