Extracellular matrix rigidity promotes invadopodia activity - PubMed (original) (raw)
Extracellular matrix rigidity promotes invadopodia activity
Nelson R Alexander et al. Curr Biol. 2008.
Abstract
Invadopodia are actin-rich subcellular protrusions with associated proteases used by cancer cells to degrade extracellular matrix (ECM) [1]. Molecular components of invadopodia include branched actin-assembly proteins, membrane trafficking proteins, signaling proteins, and transmembrane proteinases [1]. Similar structures exist in nontransformed cells, such as osteoclasts and dendritic cells, but are generally called podosomes and are thought to be more involved in cell-matrix adhesion than invadopodia [2-4]. Despite intimate contact with their ECM substrates, it is unknown whether physical or chemical ECM signals regulate invadopodia function. Here, we report that ECM rigidity directly increases both the number and activity of invadopodia. Transduction of ECM-rigidity signals depends on the cellular contractile apparatus [5-7], given that inhibition of nonmuscle myosin II, myosin light chain kinase, and Rho kinase all abrogate invadopodia-associated ECM degradation. Whereas myosin IIA, IIB, and phosphorylated myosin light chain do not localize to invadopodia puncta, active phosphorylated forms of the mechanosensing proteins p130Cas (Cas) and focal adhesion kinase (FAK) are present in actively degrading invadopodia, and the levels of phospho-Cas and phospho-FAK in invadopodia are sensitive to myosin inhibitors. Overexpression of Cas or FAK further enhances invadopodia activity in cells plated on rigid polyacrylamide substrates. Thus, in invasive cells, ECM-rigidity signals lead to increased matrix-degrading activity at invadopodia, via a myosin II-FAK/Cas pathway. These data suggest a potential mechanism, via invadopodia, for the reported correlation of tissue density with cancer aggressiveness.
Figures
Figure 1. Increased density of gelatin cushions regulates invadopodia functions
A. Wide field fluorescence images of invadopodia in CA1D cells cultured on FITC-FN/gelatin cushions with increasing gelatin percentage. Scale bars = 10 µm. B. Quantification of ECM degradation area/cell and number of functional invadopodia/cell (actin puncta associated with degradation sites). Data are represented as mean+/−standard error (SE) * indicates p value < 0.05, ** indicates p<0.06, compared with 0.5% gelatin. n=3 C. The storage moduli of gelatin cushions were measured by rheology, using a TA Instruments AR-G2 rheometer at 37°C using a 25 mm circular head. The mean values are reported from 2 independent experiments performed in triplicate.
Figure 2. ECM rigidity promotes invadopodia formation and function
A. Images of cells cultured on FITC-Fn/1% gelatin-coated polyacrylamide (PA) gels with different rigidities (“Soft” or “Hard”). Rigidity numbers reported for PA gels are in kiloPascals (kPa) and are storage moduli, empirically determined. Arrows point to example invadopodia. B. Quantification of invadopodia degradation area/cell. C. Number of F-actin/cortactin dual staining invadopodia associated with ECM degradation (“Functional Invadopodia”) per cell. Data are represented as mean+/−SE. * indicates p value < 0.05 Scale bars = 10 µm.
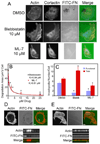
Figure 3. Inhibition of Myosin II activity eliminates invadopodia-associated ECM degradation
A. Images of CA1D cells treated with the myosin inhibitor blebbistatin and the MLCK inhibitor ML-7 after plating on FITC-FN/2.5% gelatin on glass coverslips. B. Quantification of the dose dependent inhibition of ECM degradation area/cell following treatment with the indicated doses of blebbistatin or ML-7. Data are represented as mean+/−SE. Kis were determined by fitting the data with standard hyperbolic inhibition curves according to the equation y = constant/(Ki+concentration). C. Quantification of the number of total invadopodia (all cortactin/actin-positive puncta) and functional invadopodia (cortactin/actin-positive puncta colocalized with FITC-Fn degradation) in cells treated with 10 µM blebbistatin or ML-7. * indicates p value < 0.05, compared with control cells. D. Confocal image of control cell with invadopodia degrading FITC-FN/gelatin. E. Confocal image of a cell treated with 10 µM blebbistatin. For D. & E., the cell areas within the white boxes were further imaged using Z-section analysis. Note that in blebbistatin-treated cells, the actin puncta are smaller and more numerous than in control cells and only protrude partially into the FITC-FN. In addition, unlike in control cells, there is no ECM degradation associated with actin puncta in blebbistatin-treated cells (white arrow in control FITC-FN Z-stack points to ECM degradation). Scale bars are 10 µm for A. and 2 µm for D. & E.
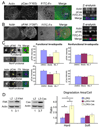
Figure 4. The mechanosensing signaling proteins FAK and p130Cas localize to and regulate invadopodia
A. Confocal immunofluorescent localization of actin filaments (Actin, blue in merges) and phospho-p130cas (Y165, red in merges) to invadopodia. ECM degradation is evident as dark areas on the FITC-fibronectin image (FITC-FN, green in merges). Z-section reconstruction shows that pY165-p130cas (pCas) is present throughout the invadopodia protrusion and colocalizes to areas of ECM degradation. B. Confocal immunofluorescent localization of phosphorylated FAK (pFAK (Y397)) to invadopodia. Colors in merges are as in A. White boxes in the merged images indicate areas analyzed in the Z-sections. C. Quantitation of phosphoFAK (Y397, “pFAK”) and phosphoCas (Y165, “pCas”) was performed by measuring absolute intensity of antibody stainings in a 4×4 pixel box (yellow boxes in zoomed images show examples) placed in the center of invadopodia, as defined by punctate actin staining. Functional invadopodia were defined to have associated ECM degradation, whereas nonfunctional did not. For A-C, cells were plated on FITC-Fn overlying 2.5% gelatin. * indicates p<0.05. D. Overexpression of FAK and Cas was achieved by retroviral transduction of CA1d cells with LZRS-MS-FAK (LZ-FAK) or LZRS-MS-Cas (LZ-Cas) vectors, to achieve a 3.1-fold or 3.7-fold increase in protein expression compared with vector only (LZ) controls (representative Western blots for total FAK or Cas protein shown, along with anti-actin Western loading controls). Degradation area per cell was measured on Hard or Soft PA gels coated with 1% gelatin/TRITC- or FITC-Fn, as in Fig 2. Results are presented as the ratio of degradation area/cell for FAK- or Cas-overexpressing cells compared with LZRS controls and show a strong effect on hard PA gels, but only a trend toward increased degradation with FAK or Cas on soft PA gels. Asterisks indicate p<0.05. Statistical significance was calculated from raw data. Error bars were converted: [raw data SEM/raw data mean] × ratio difference. Scale bar = 10 µm.
Similar articles
- Self-organized podosomes are dynamic mechanosensors.
Collin O, Na S, Chowdhury F, Hong M, Shin ME, Wang F, Wang N. Collin O, et al. Curr Biol. 2008 Sep 9;18(17):1288-94. doi: 10.1016/j.cub.2008.07.046. Epub 2008 Aug 28. Curr Biol. 2008. PMID: 18760605 Free PMC article. - Dendritic cell podosomes are protrusive and invade the extracellular matrix using metalloproteinase MMP-14.
Gawden-Bone C, Zhou Z, King E, Prescott A, Watts C, Lucocq J. Gawden-Bone C, et al. J Cell Sci. 2010 May 1;123(Pt 9):1427-37. doi: 10.1242/jcs.056515. Epub 2010 Mar 31. J Cell Sci. 2010. PMID: 20356925 Free PMC article. - Dependence of invadopodia function on collagen fiber spacing and cross-linking: computational modeling and experimental evidence.
Enderling H, Alexander NR, Clark ES, Branch KM, Estrada L, Crooke C, Jourquin J, Lobdell N, Zaman MH, Guelcher SA, Anderson AR, Weaver AM. Enderling H, et al. Biophys J. 2008 Sep;95(5):2203-18. doi: 10.1529/biophysj.108.133199. Epub 2008 May 30. Biophys J. 2008. PMID: 18515372 Free PMC article. - Regulation of invadopodia by mechanical signaling.
Parekh A, Weaver AM. Parekh A, et al. Exp Cell Res. 2016 Apr 10;343(1):89-95. doi: 10.1016/j.yexcr.2015.10.038. Epub 2015 Nov 4. Exp Cell Res. 2016. PMID: 26546985 Free PMC article. Review. - The matrix corroded: podosomes and invadopodia in extracellular matrix degradation.
Linder S. Linder S. Trends Cell Biol. 2007 Mar;17(3):107-17. doi: 10.1016/j.tcb.2007.01.002. Epub 2007 Feb 1. Trends Cell Biol. 2007. PMID: 17275303 Review.
Cited by
- RABGTPases in MT1-MMP trafficking and cell invasion: Physiology versus pathology.
Linder S, Scita G. Linder S, et al. Small GTPases. 2015;6(3):145-52. doi: 10.4161/21541248.2014.985484. Epub 2015 Jun 24. Small GTPases. 2015. PMID: 26107110 Free PMC article. - Tissue remodeling by invadosomes.
Cambi A, Chavrier P. Cambi A, et al. Fac Rev. 2021 Apr 16;10:39. doi: 10.12703/r/10-39. eCollection 2021. Fac Rev. 2021. PMID: 34046643 Free PMC article. Review. - 5'-Inositol phosphatase SHIP2 recruits Mena to stabilize invadopodia for cancer cell invasion.
Rajadurai CV, Havrylov S, Coelho PP, Ratcliffe CD, Zaoui K, Huang BH, Monast A, Chughtai N, Sangwan V, Gertler FB, Siegel PM, Park M. Rajadurai CV, et al. J Cell Biol. 2016 Sep 12;214(6):719-34. doi: 10.1083/jcb.201501003. Epub 2016 Sep 5. J Cell Biol. 2016. PMID: 27597754 Free PMC article. - Magnetic microrheometry of tumor-relevant stiffness levels and probabilistic quantification of viscoelasticity differences inside 3D cell culture matrices.
Lehtonen AJ, Arasalo O, Srbova L, Heilala M, Pokki J. Lehtonen AJ, et al. PLoS One. 2023 Mar 22;18(3):e0282511. doi: 10.1371/journal.pone.0282511. eCollection 2023. PLoS One. 2023. PMID: 36947558 Free PMC article. - Pancreatic stellate cells promote hapto-migration of cancer cells through collagen I-mediated signalling pathway.
Lu J, Zhou S, Siech M, Habisch H, Seufferlein T, Bachem MG. Lu J, et al. Br J Cancer. 2014 Jan 21;110(2):409-20. doi: 10.1038/bjc.2013.706. Epub 2013 Nov 7. Br J Cancer. 2014. PMID: 24201748 Free PMC article.
References
- Weaver AM. Invadopodia: specialized cell structures for cancer invasion. Clin Exp Metastasis. 2006;23:97–105. - PubMed
- Linder S. The matrix corroded: podosomes and invadopodia in extracellular matrix degradation. Trends Cell Biol. 2007;17:107–117. - PubMed
- Linder S, Aepfelbacher M. Podosomes: adhesion hot-spots of invasive cells. Trends Cell Biol. 2003;13:376–385. - PubMed
- Burgstaller G, Gimona M. Actin cytoskeleton remodelling via local inhibition of contractility at discrete microdomains. J Cell Sci. 2004;117:223–231. - PubMed
- Clark K, Langeslag M, Figdor CG, van Leeuwen FN. Myosin II and mechanotransduction: a balancing act. Trends Cell Biol. 2007;17:178–186. - PubMed
Publication types
MeSH terms
Substances
Grants and funding
- U54 CA113007/CA/NCI NIH HHS/United States
- U54 CA113007-04/CA/NCI NIH HHS/United States
- K22 CA109590-03/CA/NCI NIH HHS/United States
- K22CA109590/CA/NCI NIH HHS/United States
- T32 CA009592/CA/NCI NIH HHS/United States
- R01 GM075126/GM/NIGMS NIH HHS/United States
- R01 GM075126-01A2/GM/NIGMS NIH HHS/United States
- K22 CA109590/CA/NCI NIH HHS/United States
- U54CA113007/CA/NCI NIH HHS/United States
- R01GM075126/GM/NIGMS NIH HHS/United States
- T32CA09592/CA/NCI NIH HHS/United States
LinkOut - more resources
Full Text Sources
Miscellaneous


