Significant structural but not physiological changes in cortical neurons of 12-month-old Tg2576 mice - PubMed (original) (raw)
Significant structural but not physiological changes in cortical neurons of 12-month-old Tg2576 mice
Anne B Rocher et al. Neurobiol Dis. 2008 Nov.
Abstract
Amyloid-beta (Abeta) plays a key role in the etiology of Alzheimer's disease, and pyramidal cell dendrites exposed to Abeta exhibit dramatic structural alterations, including reduced dendritic spine densities. To determine whether such structural alterations lead to electrophysiological changes, whole-cell patch clamp recordings with biocytin filling were used to assess both the electrophysiological and morphological properties of layer 3 pyramidal cells in frontal cortical slices prepared from 12-month-old Tg2576 amyloid precursor protein (APP) mutant vs. wild-type (Wt) mice. Tg2576 cells exhibited significantly increased dendritic lengths and volumes and decreased spine densities, while the total number of spines was not different from Wt. Tg2576 and Wt cells did not differ with regard to passive membrane, action potential firing or glutamatergic spontaneous excitatory postsynaptic current properties. Thus, overexpression of mutated APP in young Tg2576 mice leads to significant changes in neuronal morphological properties which do not have readily apparent functional consequences.
Figures
Figure 1. Representative slice and streptavidin-Alexa labeled cells
A. Photomicrograph of a slice from a Tg2576 mouse stained with thioflavin-S showing a low density of fibrillar plaques (arrowheads) in the cortex and hippocampus (inset: boxed area at higher magnification). B. Representative streptavidin-Alexa 488 labeled layer 3 pyramidal cells from Tg2576 (top) and Wt (bottom) mice. Scale bars = A: 1 mm, inset: 25 µm; B: 100 µm.
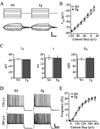
Figure 2. Passive membrane and AP firing properties were unaltered in cells from Tg2576 mice
A. Membrane voltage responses (bottom) to 200 ms injected current steps (top) from representative Wt and Tg2576 cells. B. Mean voltage response vs. current step plots for Wt and Tg2576 cells. C. Bar graphs demonstrating no significant difference between Wt and Tg2576 cells in terms of mean resting potential, membrane time constant, and input resistance. D. Trains of APs evoked by 2s depolarizing current steps of 130 pA (top) and 280 pA (bottom) for Wt and Tg2576 cells. E. Frequency-current plot demonstrating unchanged mean frequency of AP firing evoked at each depolarizing current step for Wt and Tg2576 cells. Scale bars = A: 10 mV and 50 ms; D: 20 mV and 500 ms.
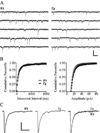
Figure 3. sEPSC properties were unaltered in cells from Tg2576 mice
A. Traces of sEPSCs from representative Wt and Tg2576 cells. B. Cumulative percentile plots of inter-event interval (left) and amplitude (right) of sEPSCs in all Wt and Tg2576 cells. C. Averaged sEPSCs from representative Wt (left) and Tg2576 (middle) cells, superimposed at right. Scale bars = A: 50 pA and 10 ms; C: 5 pA and 20 ms.
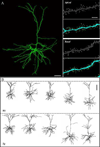
Figure 4. Representative fully reconstructed frontal cortical pyramidal cells of Tg2576 and Wt mice
A. Left: 3D montage of confocal image stacks of a pyramidal cell from a Tg2576 mouse. Right: High magnification view of dendritic segments and spines of the cell in A; raw data are shown in the grey-scale panels; and in the color panels, the same images are shown as digitized by NeuronStudio, with the reconstructed dendrites in blue and the detected spines in green. B. Representative reconstructions of Wt (top) and Tg2576 (bottom) cells. Dashed line indicates the pial surface. Scale bars = A: 40 µm; B: 5 µm; C: 100 µm.
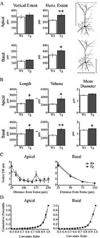
Figure 5. Dendritic length and volume were increased while branching complexity was unaltered in cells from Tg2576 mice
A. Bar graphs demonstrating that the horizontal but not vertical dendritic extents of apical (top) and basal (bottom) dendritic trees were increased in Tg2576 cells. Indication of horizontal and vertical dendritic extents are illustrated to the right. *p < 0.04; **p < 0.01. B. Bar graphs showing significantly increased mean total dendritic volume and length and unaltered mean dendritic diameter for apical (top) and increased mean total dendritic volume, length and dendritic diameter for basal (bottom) dendritic trees. *p < 0.05; **p < 0.002. C. Sholl analysis demonstrating that the number of nodes per 100 µm of dendrite within each 25 µm radial unit distal from the soma were not different in the apical (left) and basal (right) dendritic trees of Wt vs. Tg2576 cells. D. Cumulative percentile plots of the distribution of curvature ratios for all dendritic segments in either apical (left) and basal (right) trees, showing no difference between Wt and Tg2576 cells.
Figure 6. Dendritic spine number was preserved while spine density was decreased in cells from Tg2576 mice
A. Images of apical (top) and basal (bottom) dendritic branch and spine reconstructions from representative Wt (left) Tg2576 (right) cells. B. Bar graphs (left) and Sholl analysis (right) demonstrating no significant difference in the total spine numbers in the apical and basal trees in Wt vs. Tg2576 cells. C. Bar graphs (left) and Sholl analysis (right) demonstrating a significant decrease in spine density on both apical and basal dendritic trees in Tg2576 cells. * p < 0.02. D. Scatter plots of spine number (left) and spine density (middle) vs. total cell volume for individual cells, demonstrating a significant relationship with total cell volume for spine number (R = 0.57; p < 0.02) but not density (R = 0.38; p = 0.14). Scale bar in A = 7 µm.
Similar articles
- Dendritic vulnerability in neurodegenerative disease: insights from analyses of cortical pyramidal neurons in transgenic mouse models.
Luebke JI, Weaver CM, Rocher AB, Rodriguez A, Crimins JL, Dickstein DL, Wearne SL, Hof PR. Luebke JI, et al. Brain Struct Funct. 2010 Mar;214(2-3):181-99. doi: 10.1007/s00429-010-0244-2. Epub 2010 Feb 24. Brain Struct Funct. 2010. PMID: 20177698 Free PMC article. Review. - NMDA-mediated Ca(2+) influx drives aberrant ryanodine receptor activation in dendrites of young Alzheimer's disease mice.
Goussakov I, Miller MB, Stutzmann GE. Goussakov I, et al. J Neurosci. 2010 Sep 8;30(36):12128-37. doi: 10.1523/JNEUROSCI.2474-10.2010. J Neurosci. 2010. PMID: 20826675 Free PMC article. - Intraneuronal APP and extracellular Aβ independently cause dendritic spine pathology in transgenic mouse models of Alzheimer's disease.
Zou C, Montagna E, Shi Y, Peters F, Blazquez-Llorca L, Shi S, Filser S, Dorostkar MM, Herms J. Zou C, et al. Acta Neuropathol. 2015 Jun;129(6):909-20. doi: 10.1007/s00401-015-1421-4. Epub 2015 Apr 11. Acta Neuropathol. 2015. PMID: 25862638 Free PMC article. - Reduction of Dendritic Inhibition in CA1 Pyramidal Neurons in Amyloidosis Models of Early Alzheimer's Disease.
Ruiter M, Herstel LJ, Wierenga CJ. Ruiter M, et al. J Alzheimers Dis. 2020;78(3):951-964. doi: 10.3233/JAD-200527. J Alzheimers Dis. 2020. PMID: 33074225 Free PMC article. - Electrophysiological and morphological changes in striatal spiny neurons in R6/2 Huntington's disease transgenic mice.
Klapstein GJ, Fisher RS, Zanjani H, Cepeda C, Jokel ES, Chesselet MF, Levine MS. Klapstein GJ, et al. J Neurophysiol. 2001 Dec;86(6):2667-77. doi: 10.1152/jn.2001.86.6.2667. J Neurophysiol. 2001. PMID: 11731527
Cited by
- Learning to classify neural activity from a mouse model of Alzheimer's disease amyloidosis versus controls.
Beker S, Kellner V, Chechik G, Stern EA. Beker S, et al. Alzheimers Dement (Amst). 2016 Feb 3;2:39-48. doi: 10.1016/j.dadm.2016.01.002. eCollection 2016. Alzheimers Dement (Amst). 2016. PMID: 27239535 Free PMC article. - A Novel Form of Compensation in the Tg2576 Amyloid Mouse Model of Alzheimer's Disease.
Somogyi A, Katonai Z, Alpár A, Wolf E. Somogyi A, et al. Front Cell Neurosci. 2016 Jun 16;10:152. doi: 10.3389/fncel.2016.00152. eCollection 2016. Front Cell Neurosci. 2016. PMID: 27378850 Free PMC article. - Caffeine Consumption During Pregnancy Accelerates the Development of Cognitive Deficits in Offspring in a Model of Tauopathy.
Zappettini S, Faivre E, Ghestem A, Carrier S, Buée L, Blum D, Esclapez M, Bernard C. Zappettini S, et al. Front Cell Neurosci. 2019 Oct 1;13:438. doi: 10.3389/fncel.2019.00438. eCollection 2019. Front Cell Neurosci. 2019. PMID: 31680863 Free PMC article. - Early fear memory defects are associated with altered synaptic plasticity and molecular architecture in the TgCRND8 Alzheimer's disease mouse model.
Steele JW, Brautigam H, Short JA, Sowa A, Shi M, Yadav A, Weaver CM, Westaway D, Fraser PE, St George-Hyslop PH, Gandy S, Hof PR, Dickstein DL. Steele JW, et al. J Comp Neurol. 2014 Jul 1;522(10):2319-35. doi: 10.1002/cne.23536. J Comp Neurol. 2014. PMID: 24415002 Free PMC article. - Dendritic vulnerability in neurodegenerative disease: insights from analyses of cortical pyramidal neurons in transgenic mouse models.
Luebke JI, Weaver CM, Rocher AB, Rodriguez A, Crimins JL, Dickstein DL, Wearne SL, Hof PR. Luebke JI, et al. Brain Struct Funct. 2010 Mar;214(2-3):181-99. doi: 10.1007/s00429-010-0244-2. Epub 2010 Feb 24. Brain Struct Funct. 2010. PMID: 20177698 Free PMC article. Review.
References
- Almeida CG, Tampellini D, Takahashi RH, Greengard P, Lin MT, Snyder EM, Gouras GK. Beta-amyloid accumulation in APP mutant neurons reduces PSD-95 and GluR1 in synapses. Neurobiol Dis. 2005;20:187–198. - PubMed
- Alpar A, Ueberham U, Bruckner MK, Seeger G, Arendt T, Gartner U. Different dendrite and dendritic spine alterations in basal and apical arbors in mutant human amyloid precursor protein transgenic mice. Brain Res. 2006;1099:189–198. - PubMed
- Chang YM, Rosene DL, Killiany RJ, Mangiamele LA, Luebke JI. Increased action potential firing rates of layer 2/3 pyramidal cells in the prefrontal cortex are significantly related to cognitive performance in aged monkeys. Cereb Cortex. 2005;15:409–418. - PubMed
Publication types
MeSH terms
Substances
LinkOut - more resources
Full Text Sources
Medical
Molecular Biology Databases


