Accurate taxonomy assignments from 16S rRNA sequences produced by highly parallel pyrosequencers - PubMed (original) (raw)
Comparative Study
Accurate taxonomy assignments from 16S rRNA sequences produced by highly parallel pyrosequencers
Zongzhi Liu et al. Nucleic Acids Res. 2008 Oct.
Abstract
The recent introduction of massively parallel pyrosequencers allows rapid, inexpensive analysis of microbial community composition using 16S ribosomal RNA (rRNA) sequences. However, a major challenge is to design a workflow so that taxonomic information can be accurately and rapidly assigned to each read, so that the composition of each community can be linked back to likely ecological roles played by members of each species, genus, family or phylum. Here, we use three large 16S rRNA datasets to test whether taxonomic information based on the full-length sequences can be recaptured by short reads that simulate the pyrosequencer outputs. We find that different taxonomic assignment methods vary radically in their ability to recapture the taxonomic information in full-length 16S rRNA sequences: most methods are sensitive to the region of the 16S rRNA gene that is targeted for sequencing, but many combinations of methods and rRNA regions produce consistent and accurate results. To process large datasets of partial 16S rRNA sequences obtained from surveys of various microbial communities, including those from human body habitats, we recommend the use of Greengenes or RDP classifier with fragments of at least 250 bases, starting from one of the primers R357, R534, R798, F343 or F517.
Figures
Figure 1.
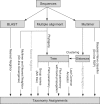
Overview of different methods for taxonomy assignment (see text for details).
Figure 2.
‘Leave-one-out’ evaluations of full-length sequences from Bergey's Manual. The _x_-axis shows recovery (i.e. fraction of sequences given their correct assignment). The _y_-axis shows coverage (i.e. fraction of sequences for which an assignment could be made using each method). Each line represents the assignments of a chosen method at different ranks. Each colored point represents a rank (blue to red correspond to levels from domain to genus). Gray arrows indicate effect of including/excluding sequences that are the sole representative of their genera. (a) BLAST methods. See the text for ‘nearest neighbors’, ‘more neighbors’, ‘common lineage’ and ‘major lineage’. (b) Tree-based methods followed by Fitch parsimony assignment. ‘NAST’, ‘NAST_Kimura’ are phylogenetic tree-based methods that build the relaxed NJ tree from NAST alignments. With ‘NAST_Kimura’, a Kimura adjustment was applied to the distance matrix before tree building. ‘3-mer’, ‘5-mer’: multimer clustering tree-based method that builds the relaxed NJ tree from a Bray–Curtis distance matrix obtained from the multimer (3-mer or 5-mer) count matrix.
Figure 3.
‘Leave-one-out’ recoveries at the genus level for clipped sequences from Bergey's Manual. The _x_-axis shows the primer and the length of the read. The _y_-axis shows recovery (a) or coverage (b) for each method. Recovery and coverage are defined as in Figure 2. Each method is represented as a line. ‘BLAST’, BLAST method using ‘common lineage for more neighbors’; ‘NAST-Fitch’, ‘NAST-FitchAndBack’, and ‘NAST-LCA’: these phylogenetic tree-based methods build trees from NAST alignments with Kimura correction, followed by Fitch parsimony, Fitch parsimony with back-propagation, and last common ancestor algorithm, respectively. ‘5-mer-Fitch’: multimer clustering tree-based method using Fitch parsimony algorithm (the same with ‘5-mer’ in Figure 2).
Figure 4.
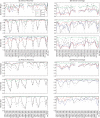
Recoveries and coverage at the genus level (a and b) and phylum level (c and d) for each of the three datasets: the Guerrero Negro microbial mat, the mouse gut and the human gut. The legend for the series in the first panel applies to all panels. Each line represents the performance (recovery or coverage) of one method on one dataset. The _x_-axis represents primer name and sequence lengths. Apart from the coverage of ‘ORI_seqs’, which is the fraction of full-length sequences with an assignment at a certain rank, recovery and coverage are measured relative to the results of the full-length sequence. Missing data points are for reads that extend past the length of the near full-length amplicons used for this study. Recovery and coverage are defined as in Figure 2.
Figure 5.
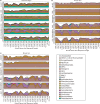
Compositions at the phylum level for each of the three datasets: (a) Guerrero Negro mat, (b) Human gut and (c) Mouse gut, using a range of different methods (separate subpanels within each group). The _x_-axis of each graph shows region sequenced. The _y_-axis shows abundance as a fraction of the total number of sequences in the community. The legend shows colors for phyla (consistent across graphs).
Figure 6.
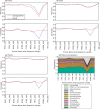
Comparison of recoveries and coverage using ARB and either the group name or Fitch parsimony criteria for grouping sequences. The _x_-axis of each graph shows the region of the gene encompassed by the sequence (all 100-base clipped sequences). The _y_-axis plots either coverage or recovery, defined as in Figure 2. Results are shown for (a) family, (b) class and (c) phylum. (d) Compositions at the phylum level obtained using the Group Name method for the combined dataset (i.e. Guerrero Negro mat, mouse gut and human gut).
Figure 7.
Run time performance of the different methods as a function of the number and length of sequences. The _x_-axis plots the number of sequences, the _y_-axis time (in seconds). The legend shows colors for length of sequence. The error bars represent SDs from 10 replicates.
Similar articles
- Construction & assessment of a unified curated reference database for improving the taxonomic classification of bacteria using 16S rRNA sequence data.
Agnihotry S, Sarangi AN, Aggarwal R. Agnihotry S, et al. Indian J Med Res. 2020 Jan;151(1):93-103. doi: 10.4103/ijmr.IJMR_220_18. Indian J Med Res. 2020. PMID: 32134020 Free PMC article. - Naive Bayesian classifier for rapid assignment of rRNA sequences into the new bacterial taxonomy.
Wang Q, Garrity GM, Tiedje JM, Cole JR. Wang Q, et al. Appl Environ Microbiol. 2007 Aug;73(16):5261-7. doi: 10.1128/AEM.00062-07. Epub 2007 Jun 22. Appl Environ Microbiol. 2007. PMID: 17586664 Free PMC article. - Species-level bacterial community profiling of the healthy sinonasal microbiome using Pacific Biosciences sequencing of full-length 16S rRNA genes.
Earl JP, Adappa ND, Krol J, Bhat AS, Balashov S, Ehrlich RL, Palmer JN, Workman AD, Blasetti M, Sen B, Hammond J, Cohen NA, Ehrlich GD, Mell JC. Earl JP, et al. Microbiome. 2018 Oct 23;6(1):190. doi: 10.1186/s40168-018-0569-2. Microbiome. 2018. PMID: 30352611 Free PMC article. - TaxAss: Leveraging a Custom Freshwater Database Achieves Fine-Scale Taxonomic Resolution.
Rohwer RR, Hamilton JJ, Newton RJ, McMahon KD. Rohwer RR, et al. mSphere. 2018 Sep 5;3(5):e00327-18. doi: 10.1128/mSphere.00327-18. mSphere. 2018. PMID: 30185512 Free PMC article. - Modified RNA-seq method for microbial community and diversity analysis using rRNA in different types of environmental samples.
Yan YW, Zou B, Zhu T, Hozzein WN, Quan ZX. Yan YW, et al. PLoS One. 2017 Oct 10;12(10):e0186161. doi: 10.1371/journal.pone.0186161. eCollection 2017. PLoS One. 2017. PMID: 29016661 Free PMC article.
Cited by
- Inhibition of the endosymbiont "Candidatus Midichloria mitochondrii" during 16S rRNA gene profiling reveals potential pathogens in Ixodes ticks from Australia.
Gofton AW, Oskam CL, Lo N, Beninati T, Wei H, McCarl V, Murray DC, Paparini A, Greay TL, Holmes AJ, Bunce M, Ryan U, Irwin P. Gofton AW, et al. Parasit Vectors. 2015 Jun 25;8:345. doi: 10.1186/s13071-015-0958-3. Parasit Vectors. 2015. PMID: 26108374 Free PMC article. - Vitamin D and allergic airway disease shape the murine lung microbiome in a sex-specific manner.
Roggenbuck M, Anderson D, Barfod KK, Feelisch M, Geldenhuys S, Sørensen SJ, Weeden CE, Hart PH, Gorman S. Roggenbuck M, et al. Respir Res. 2016 Sep 21;17(1):116. doi: 10.1186/s12931-016-0435-3. Respir Res. 2016. PMID: 27655266 Free PMC article. - Preliminary characterization of the oral microbiota of Chinese adults with and without gingivitis.
Huang S, Yang F, Zeng X, Chen J, Li R, Wen T, Li C, Wei W, Liu J, Chen L, Davis C, Xu J. Huang S, et al. BMC Oral Health. 2011 Dec 12;11:33. doi: 10.1186/1472-6831-11-33. BMC Oral Health. 2011. PMID: 22152152 Free PMC article. - Interpreting Prevotella and Bacteroides as biomarkers of diet and lifestyle.
Gorvitovskaia A, Holmes SP, Huse SM. Gorvitovskaia A, et al. Microbiome. 2016 Apr 12;4:15. doi: 10.1186/s40168-016-0160-7. Microbiome. 2016. PMID: 27068581 Free PMC article. - Monitoring the variation in the gut microbiota of captive woolly monkeys related to changes in diet during a reintroduction process.
Quiroga-González C, Cardenas LAC, Ramírez M, Reyes A, González C, Stevenson PR. Quiroga-González C, et al. Sci Rep. 2021 Mar 22;11(1):6522. doi: 10.1038/s41598-021-85990-0. Sci Rep. 2021. PMID: 33753830 Free PMC article.
References
- Rappe MS, Giovannoni SJ. The uncultured microbial majority. Annu. Rev. Microbiol. 2003;57:369–394. - PubMed
- Pace NR. A molecular view of microbial diversity and the biosphere. Science. 1997;276:734–740. - PubMed
Publication types
MeSH terms
Substances
LinkOut - more resources
Full Text Sources
Other Literature Sources
Research Materials


