Snrk-1 is involved in multiple steps of angioblast development and acts via notch signaling pathway in artery-vein specification in vertebrates - PubMed (original) (raw)
Snrk-1 is involved in multiple steps of angioblast development and acts via notch signaling pathway in artery-vein specification in vertebrates
Chang Z Chun et al. Blood. 2009.
Abstract
In vertebrates, molecular mechanisms dictate angioblasts' migration and subsequent differentiation into arteries and veins. In this study, we used a microarray screen to identify a novel member of the sucrose nonfermenting related kinase (snrk-1) family of serine/threonine kinases expressed specifically in the embryonic zebrafish vasculature and investigated its function in vivo. Using gain- and loss-of-function studies in vivo, we show that Snrk-1 plays an essential role in the migration, maintenance, and differentiation of angioblasts. The kinase function of Snrk-1 is critical for migration and maintenance, but not for the differentiation of angioblasts. In vitro, snrk-1 knockdown endothelial cells show only defects in migration. The snrk-1 gene acts downstream or parallel to notch and upstream of gridlock during artery-vein specification, and the human gene compensates for zebrafish snrk-1 knockdown, suggesting evolutionary conservation of function.
Figures
Figure 1
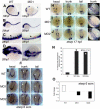
Expression of snrk-1 during embryonic zebrafish development. (A-F) Whole-mount in situ hybridizations using digoxigenin-labeled snrk-1 antisense probes. At 24 hpf (A,B) and beyond (C-E) until 96 hpf (F), snrk-1 expression is restricted to head and trunk regions. In the trunk, section of 24 hpf snrk-1 in situ embryo (H) show expression in the dorsal aorta (DA), posterior cardinal vein (PCV), and the regions surrounding these 2 structures. No indicates notochord. Red arrow points to PCV and black arrow points to DA. The plane of the section in panel H is shown in panel G. (I) The orientation of the embryos.
Figure 2
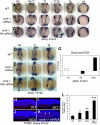
Snrk-1 gene knockdown analysis in vivo. (A-D) Endothelial cells at 18 hpf and 28 hpf in wild-type (WT) and MO1-injected embryos are visualized by in situ hybridization using a fli antisense RNA probe. (C,D) High-magnification images of the trunk and head, respectively, of WT and MO1-injected embryos from panel B. Reduction of ECs is observed at (A) 18 hpf and (B) 28 hpf in MO1-injected embryos. Red bracket in panel C shows reduction of fli+ region composed of DA and PCV, and black asterisk shows that intersomitic vessels (ISVs) are missing at 28 hpf in MO1-injected embryos. (A-C) Lateral views. (D) Dorsal view. etsrp+ angioblasts in the head, trunk, and tail at (E-G) 6 som and (H-M) 17 hpf in WT, MO1-, and MO2-injected embryos. White asterisks in panels E through G are included for etsrp+ cell comparison across comparable regions in the 3 samples. At 17 hpf, in the head, compare 4 populations of etsrp+ angioblasts—of which the most anterior are enclosed in red box. In the trunk, 2 bilateral stripes of etsrp+ angioblasts are noticed, of which one stripe is missing in MO1-injected embryo (I, trunk). In the tail, 2 distinct etsrp+ angioblast populations merge at the tail tip indicated by the black box, and differences are noticed in their intensities and patterning in MO-injected embryos compared with WT. (K-M) Embryos overstained with etsrp probe. (L,M) Overstained embryos in which etsrp+ angioblasts are mispatterned. (N) The percentage of MO1- and MO2-injected embryos with mislocalized angioblasts at 17 hpf; *P < .001 between MO1- or MO2-injected groups compared with UI. (O) The fold change of etsrp transcript levels at 6 som in MO1- and MO2-injected embryos as analyzed by QPCR. Error bars represent SEM.
Figure 3
Gain-of-function analysis by overexpression of snrk-1 and snrk-1 kinase mutant (snrk-1 KM). (A-C) etsrp+ cells in the head (Hd), head to trunk (Hd-Tr), trunk (Tr), trunk to tail (Tr-Ta), tail (Ta), and lateral regions (La) of WT embryos (A), snrk-1 mRNA–injected (B), and snrk-1 KM mRNA–injected (C) embryos. (B) Ectopic induction of etsrp+ cells in snrk-1 mRNA–injected embryos. (A,B) Black asterisks in Tr-Ta and Ta panels indicate thicker etsrp-stained region at LPM in panel B compared with panel A. (C) snrk-1 KM mRNA–injected embryos with early migration of angioblasts from the LPM to the midline. (C, Tr-Ta) Inset is higher magnification of prematurely migrating angioblasts at 6 som. (D-F) etsrp+ cells in Hd, Tr, and Ta regions at 19 hpf in WT, snrk-1 mRNA–, and KM mRNA–injected embryos. (G) The fold change of etsrp transcript levels in snrk-1 mRNA– and KM mRNA–injected embryos at 6 som by QPCR. (H-K) An in vivo TUNEL apoptosis assay at 24 hpf in WT, MO1-, MO2-, and snrk-1 mRNA–injected embryos. (J,K) Arrows indicate apoptotic cells. (L) The mean number of apoptotic nuclei (x-axis) in the vessel region in each sample (y-axis: WT, n = 10; MO1, n = 14; MO2, n = 18; snrk-1 mRNA, n = 11), with the error bars representing SD. Paired t test: *P < .05 between WT and MO1; **P < .05 between WT and MO2; ***P < .005 between WT and snrk-1 mRNA samples.
Figure 4
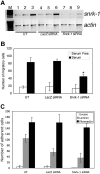
Snrk-1 gene knockdown analysis in vitro. (A) RT-PCR for snrk-1 and actin genes in snrk-1 siRNA–transfected (500 ng) and control lacZ siRNA–transfected (500 ng) HUVECs. Lanes 7 through 9 show reduced snrk-1 transcripts compared with lanes 1 through 6. (B) In vitro KD studies show that there are fewer migratory ECs in snrk-1 siRNA–transfected HUVECs. The graph shows the effect of snrk-1 gene KD on migration of transfected HUVECs to serum-free medium (□) or 10% serum (■) for 5 hours at 37°C. All migration experiments have been conducted using HUVECs from passage numbers 2 through 4. The plotted data are pooled from 3 independent experiments and the error bars represent plus or minus SD. *P < .05 between snrk-1 siRNA and lacZ siRNA cells response to serum. (C) Graphic representation of the number of adherent ECs in snrk-1 siRNA–transfected, lacZ control siRNA–transfected, or untransfected HUVECs to an uncoated surface (□), laminin ( ), or fibronectin (■). Error bars represent SD.
Figure 5
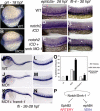
Snrk-1 functions in A/V specification. (A,B) grl in situ hybridization of 18 hpf WT and MO2-injected embryos, respectively. ephrin-B2a in situ hybridization of 26 hpf (C) WT, (D) _notch2-ICD_–injected, or (E) notch2-ICD + snrk-1 MO1–injected embryos. flt-4 in situ hybridization of 30 hpf (F) WT, (G) _notch2-ICD_–injected, and (H) notch2-ICD + snrk-1 MO1–injected embryos. (F-H) White asterisks show flt-4 expression in intersomitic arteries. (C-E) The black brackets indicate the space between the most dorsal stained regions of the embryo to the yolk extension. (D) Note the shrinkage in space in notch2-ICD_–injected embryo, indicating an expansion of ephrin-B2a_–stained cells. fli in situ hybridization of 26 to 28 hpf (I) WT, (J) MO1-injected, and (K) MO1 + h_snrk-1 RNA–injected embryos. (J,M) MO1-injected embryos missing ISVs compared with (I,L) WT or (K,N) MO1 + h_snrk-1_–coinjected embryos. (O) Graphic representation of the number of embryos displaying faint or absent ISVs in the trunk region of samples in panels I through K. *P < .001 across MO1 and MO1 + h_snrk-1 group. (P) A model placing Snrk-1 parallel to Notch in A/V specification. The dotted line indicates that definitive evidence is needed to show that snrk-1 is downstream of notch. Images in panels C through H were taken using an Observer Z1 inverted microscope (Carl Zeiss, Thornwood, NY) with 10× objective and 10× eyepiece. The image acquisition software used was AxioVision Rel4.6 (Carl Zeiss, Oberkochen, Germany); images were corrected for brightness and contrast in Photoshop 7.0.
Comment in
- The hunting of the Snrk.
Arbiser JL, Fried L. Arbiser JL, et al. Blood. 2009 Jan 29;113(5):983-4. doi: 10.1182/blood-2008-10-179119. Blood. 2009. PMID: 19179474 No abstract available.
Similar articles
- The LIM-homeodomain transcription factor Islet2a promotes angioblast migration.
Lamont RE, Wu CY, Ryu JR, Vu W, Davari P, Sobering RE, Kennedy RM, Munsie NM, Childs SJ. Lamont RE, et al. Dev Biol. 2016 Jun 15;414(2):181-92. doi: 10.1016/j.ydbio.2016.04.019. Epub 2016 Apr 25. Dev Biol. 2016. PMID: 27126199 - Dusp-5 and Snrk-1 coordinately function during vascular development and disease.
Pramanik K, Chun CZ, Garnaas MK, Samant GV, Li K, Horswill MA, North PE, Ramchandran R. Pramanik K, et al. Blood. 2009 Jan 29;113(5):1184-91. doi: 10.1182/blood-2008-06-162180. Epub 2008 Oct 16. Blood. 2009. PMID: 18927432 Free PMC article. - Artery/vein specification is governed by opposing phosphatidylinositol-3 kinase and MAP kinase/ERK signaling.
Hong CC, Peterson QP, Hong JY, Peterson RT. Hong CC, et al. Curr Biol. 2006 Jul 11;16(13):1366-72. doi: 10.1016/j.cub.2006.05.046. Curr Biol. 2006. PMID: 16824925 Free PMC article. - Arterial-venous specification during development.
Swift MR, Weinstein BM. Swift MR, et al. Circ Res. 2009 Mar 13;104(5):576-88. doi: 10.1161/CIRCRESAHA.108.188805. Circ Res. 2009. PMID: 19286613 Review. - MAPping out arteries and veins.
Lamont RE, Childs S. Lamont RE, et al. Sci STKE. 2006 Oct 3;2006(355):pe39. doi: 10.1126/stke.3552006pe39. Sci STKE. 2006. PMID: 17018851 Review.
Cited by
- Snf1-related kinase inhibits colon cancer cell proliferation through calcyclin-binding protein-dependent reduction of β-catenin.
Rines AK, Burke MA, Fernandez RP, Volpert OV, Ardehali H. Rines AK, et al. FASEB J. 2012 Nov;26(11):4685-95. doi: 10.1096/fj.12-212282. Epub 2012 Aug 8. FASEB J. 2012. PMID: 22874833 Free PMC article. - Overexpression of circRNA SNRK targets miR-103-3p to reduce apoptosis and promote cardiac repair through GSK3β/β-catenin pathway in rats with myocardial infarction.
Zhu Y, Zhao P, Sun L, Lu Y, Zhu W, Zhang J, Xiang C, Mao Y, Chen Q, Zhang F. Zhu Y, et al. Cell Death Discov. 2021 Apr 19;7(1):84. doi: 10.1038/s41420-021-00467-3. Cell Death Discov. 2021. PMID: 33875647 Free PMC article. - DNA damage and nuclear morphological changes in cardiac hypertrophy are mediated by SNRK through actin depolymerization.
Stanczyk P, Tatekoshi Y, Shapiro JS, Nayudu K, Chen Y, Zilber Z, Schipma M, De Jesus A, Mahmoodzadeh A, Akrami A, Chang HC, Ardehali H. Stanczyk P, et al. bioRxiv [Preprint]. 2023 Jul 14:2023.07.14.549060. doi: 10.1101/2023.07.14.549060. bioRxiv. 2023. PMID: 37503243 Free PMC article. Updated. Preprint. - DNA Damage and Nuclear Morphological Changes in Cardiac Hypertrophy Are Mediated by SNRK Through Actin Depolymerization.
Stanczyk PJ, Tatekoshi Y, Shapiro JS, Nayudu K, Chen Y, Zilber Z, Schipma M, De Jesus A, Mahmoodzadeh A, Akrami A, Chang HC, Ardehali H. Stanczyk PJ, et al. Circulation. 2023 Nov 14;148(20):1582-1592. doi: 10.1161/CIRCULATIONAHA.123.066002. Epub 2023 Sep 18. Circulation. 2023. PMID: 37721051 Free PMC article. - SNRK (Sucrose Nonfermenting 1-Related Kinase) Promotes Angiogenesis In Vivo.
Lu Q, Xie Z, Yan C, Ding Y, Ma Z, Wu S, Qiu Y, Cossette SM, Bordas M, Ramchandran R, Zou MH. Lu Q, et al. Arterioscler Thromb Vasc Biol. 2018 Feb;38(2):373-385. doi: 10.1161/ATVBAHA.117.309834. Epub 2017 Dec 14. Arterioscler Thromb Vasc Biol. 2018. PMID: 29242271 Free PMC article.
References
- Baldwin HS. Early embryonic vascular development. Cardiovasc Res. 1996;31 Spec No: E34–E45. - PubMed
- Poole TJ, Coffin JD. Vasculogenesis and angiogenesis: two distinct morphogenetic mechanisms establish embryonic vascular pattern. J Exp Zool. 1989;251:224–231. - PubMed
- Westerfield M. The Zebrafish Book. 4th ed. Eugene, OR: University of Oregon Press; 2000.
- Kimmel CB, Ballard WW, Kimmel SR, Ullmann B, Schilling TF. Stages of embryonic development of the zebrafish. Dev Dyn. 1995;203:253–310. - PubMed
Publication types
MeSH terms
Substances
Grants and funding
- HL072178/HL/NHLBI NIH HHS/United States
- R01 HL102745/HL/NHLBI NIH HHS/United States
- R01 HL090712-02/HL/NHLBI NIH HHS/United States
- HL70567/HL/NHLBI NIH HHS/United States
- R01 HL070567/HL/NHLBI NIH HHS/United States
- R01 HL090712/HL/NHLBI NIH HHS/United States
- R01 HL102745-01A1/HL/NHLBI NIH HHS/United States
- R01 HL072178/HL/NHLBI NIH HHS/United States
LinkOut - more resources
Full Text Sources
Molecular Biology Databases


