Expression of angiotensin-converting enzyme (CD143) identifies and regulates primitive hemangioblasts derived from human pluripotent stem cells - PubMed (original) (raw)
Expression of angiotensin-converting enzyme (CD143) identifies and regulates primitive hemangioblasts derived from human pluripotent stem cells
Elias T Zambidis et al. Blood. 2008.
Abstract
We report that angiotensin-converting enzyme (ACE), a critical physiologic regulator of blood pressure, angiogenesis, and inflammation, is a novel marker for identifying hemangioblasts differentiating from human embryonic stem cells (hESC). We demonstrate that ACE+CD45-CD34+/- hemangioblasts are common yolk sac (YS)-like progenitors for not only endothelium but also both primitive and definitive human lymphohematopoietic cells. Thrombopoietin and basic fibroblast growth factor are identified as critical factors for the proliferation of human hemangioblasts. The developmental sequence of human embryoid body hematopoiesis is remarkably congruent to the timeline of normal human YS development, which occurs during weeks 2 to 6 of human gestation. Furthermore, ACE and the renin-angiotensin system (RAS) directly regulate hemangioblast expansion and differentiation via signaling through the angiotensin II receptors AGTR1 and AGTR2. ACE enzymatic activity is required for hemangioblast expansion, and differentiation toward either endothelium or multipotent hematopoietic progenitors is dramatically augmented after manipulation of angiotensin II signaling with either AGTR1- or AGTR2-specific inhibitors. The RAS can therefore be exploited to direct the hematopoietic or endothelial fate of hESC-derived hemangioblasts, thus providing novel opportunities for human tissue engineering. Moreover, the initial events of human hematoendotheliogenesis can be delineated in a manner previously impossible because of inaccessibility to early human embryonic tissues.
Figures
Figure 1
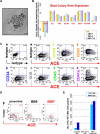
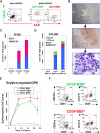
Phenotype of ACE + blast colonies generated in SF conditions. (A) Typical morphology of a blast colony with loosely packed cells generated from day 7 (line H1) hEB differentiated in BVF2H; 5-6 days post-hEB cell plating. (B) Quantitative RT-PCR expression profiles: day 9 hEB blasts were expanded with 50 ng/mL TPO alone (T), 50 ng/mL each of SCF, BMP4, FGF2/heparin, TPO (SBF + T), 50 ng/mL each of SCF, BMP4, FGF2/heparin, VEGF (SBF + V), or 50 ng/mL each of SCF, BMP4, FGF2/heparin, TPO, and VEGF (SBF + T + V). Blast colonies (∼10-15) from each GF condition were plucked from methylcellulose, pooled for RNA harvest, and analyzed for expression of indicated transcripts by qRT-PCR, using the 2−ΔΔT method (see Document S1). Shown are the relative, normalized expressions of CDX4, SCL, VWF, VE-cadherin, TIE-2, GATA1, PECAM1, and KDR/flk1 compared with expressions in control, undifferentiated day 9 hEB cells. qRT-PCR products were verified to be specifically amplified by agarose gel electrophoresis at linear ranges of amplification for the indicated conditions (data not shown). (C) FACS analysis of pooled (∼8-10) blast colonies from day 7 hEB cells revealed abundant expression of ACE/BB9, CD164, CD41a, and CD43, and minor amounts of CD34, KDR, and CD45. BL-CFC activity is contained entirely within BB9+ hEB cell fractions. (D) Single cell suspensions from a representative sorting experiment: day 8 hEB (presorted hEB; hESC lines H1 and H9) were FACS-purified into BB9+ or BB9− sorted populations as described under “Methods.” (E) Eight to 15 × 104 viable, purified day 8 hEB cells, or 15 × 104 viable, presorted total day 8 hEB cells from lines H1 or H9 (differentiated as described in Document S1) were recultured in duplicate in SF methylcellulose containing 50 ng/mL each of BMP4, FGF2/heparin, TPO, VEGF, and IL-6. Blast colonies generated per viable, sorted hEB cells plated were enumerated after 4 to 5 days.
Figure 2
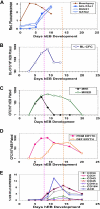
Differentiation kinetics and surface phenotypes of clonogenic progenitors of hEB-derived primitive and definitive hematopoieses. Line H1 hEB were differentiated in SF medium and BVF2H for 3-20 days, as described under “Methods.” hEB cells at different time points were evaluated for global gene expressions (A) by DNA microarray (Agilent) analysis (see Table S2 for full list), surface marker expression (E), or recultured at indicated time points in CFC assays (B-D). Replicate CFC assay results represent the average, normalized (per 106 single, viable hEB cells plated), for independent experiments done at least 3 times, with all standard deviations less than 5%-10%). (A) Mesoderm marker Brachyury and hemangioblast-associated (SCL/TAL1, RUNX1, GATA2) genes during days 0-10 of hEB differentiation are selectively shown. (B) The kinetics of formation of BL-CFC, (C) MHE clusters, mixed primitive + definitive erythro-myelopoietic colonies (MIXED) colonies, (D) primitive erythropoietic (PRIM ERYTH), and definitive erythropoietic (DEF ERYTH) CFU are shown during days 3-20 of hEB differentiation. Purple vertical dashed line emphasizes that the initiation and pattern of blast colony formation (starting at day 5 of hEB differentiation) which correlates simultaneously with the onset of ACE/BB9 and CD34 hEB expression and also the emergence of primitive multipotent (MIXED), also primitive erythroid (PRIM ERYTH) CFU (E). In contrast, CD34, CD164, CD31, CD43, and CD41a hEB cell peak cell surface expressions patterns correlated more with the emergence of definitive-type CFU from hEB at later time points (orange dashed line).
Figure 3
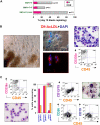
Hematopoietic potential of ACE+ blast colonies. (A) Secondary colony replating efficiencies of individually picked blast colonies. Blast colonies from hESC Line H1 day 9-10 hEB cells were generated, as described in “Methods,” in the presence of 50 ng/mL each of SCF, BMP4, FGF2/heparin + VEGF (SBFH + V), 50 ng/mL each of SCF, BMP4, FGF2/heparin + TPO + VEGF (SBFH + T + V), or 50 ng/mL each of SCF, BMP4, FGF2/heparin + TPO + VEGF + IL-6 (SBFH + T + V + IL-6). The percentage of individually picked blast colonies that formed secondary hematopoietic-only (H), or hematopoietic and endothelial (HE) colonies, for each condition is shown. The addition of IL-6 did not increase the frequency of blast colony generation (data not shown) but greatly enhanced their secondary replating potential to aproximately 80%. Shown is a representative experiment (done at least twice), with the number of single blast colonies evaluated per condition (n = 11). Day 5-9 hEB-derived blast colonies were individually plucked, and secondarily recultured (5-6 days after single hEB cell plating) into single wells on either (B) fibronectin-coated dishes containing SF methylcellulose medium and GFs (SCF, BMP4, Flt3L, TPO, IGF-1, GCSF, GMCSF, IL-3, IL-6, EPO, VEGF), or (C) OP9 bone marrow stromal layers containing the same GFs, for definitive hematopoietic differentiation. Day 5 hEB blast colonies secondarily recultured into SF conditions consistently resulted in simultaneous differentiation into primitive, YS-like CD235a/CD45- erythro-myelopoietic (B, left panel and far right panels), and adherent endothelial cells that take up acetylated Dil-LDL (B, middle panel). Nuclei are stained blue with DAPI. These erythroblasts express only ε and γ, but not β hemoglobin chains (C; “SF,” middle panel). In contrast, single blast colonies recultured onto OP9 layers with human lymphohematopoietic growth factors (EPO, SCF, Flt3L, TPO, IL-3, IL-6, G-CSF, GM-CSF, IL-2, IL-7, IL-15) produced definitive-type CD235a/CD45+ erythromyelopoietic differentiation (C, top left panel), with enucleating β hemoglobin-expressing erythrocytes (C, bottom left panel), definitive-type myeloid cells (C, top right panel, CD13 + CD15 + CD45+), and also NK-lymphoid (CD56 + CD45+) but scarce amounts of phenotypic B-lymphoid cells (CD19+ CD45+; C, bottom right panel).
Figure 4
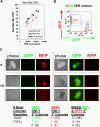
A single hEB cell generates one blast colony with bipotential hematoendothelial capacity. (A) hEB cell dose response. To demonstrate that a single hEB cell has hemangioblastic capacity, the linear correlation of BL-CFC to the number of unfractionated Line H1 day 8 hEB plated was evaluated. Shown is the direct linear relationship observed with a slope ∼1, which is highly suggestive that each colony is derived from a single colony-forming cell. hEB cells from H1 hESC subclones transduced with lentiviral constructs expressing GFP or RFP demonstrated robust BL-CFC formation comparable with the H1 parental line (WT), with a similar linear correlation to numbers of cells plated. (B,C) GFP-RFP hEB Mixing Experiments. To further rule out the possibility that BL-CFC have apparent bipotentiality from the possibility that 2 separately derived progenitors are stuck or fused together, a 50:50 single-cell suspension mixture of GFP-expressing and RFP-expressing day 9 hEB cells was prepared (B), and blast colonies (phase image, “B” were expanded from this GFP-RFP mixture in BVF2H + TPO + IL-6, as before. (C) Secondary colonies from individually replated blast colonies (“B”) produced secondary endothelial colonies (“E”), hematopoietic colonies (“H”), or mixed hematoendothelial (“HE”) colonies. These secondary colonies were always GFP or RFP-expressing under fluorescent microscopy, and there were never colonies with both GFP and RFP expression mixed together. This experiment (with n = 24 picked blast colonies replated) was repeated with similar results, for a total of n = 50 colonies evaluated.
Figure 5
Hematopoietic potential of purified BB9+ and CD34+ hEB populations. Line H1 day 9 hEB cell suspensions (presorted) were FACS-purified into (A) CD34+BB9+, CD34−BB9+, and CD34−BB9− fractions (postsort analysis of purified positive fractions shown in middle and right panels). (B-D) Sorted cells were cultured onto duplicate fibronectin-coated dishes with SF methylcellulose and hemato-endothelial GFs, as described under “SF clonogenic assays for hematopoietic and hemangioblastic colony-forming cells.” (B,C) single day 9 CD34+BB9+ and CD34−BB9+ (but not CD34−BB9−) hEB cells differentiated into hemangioblastic colonies of mixed primitive erythromyeloid cells and adherent endothelioid cells (MIXED-HE), as well as primitive erythroid (EryP) colonies. Day 14 hEB similarly FACS-purified into these same populations (D), generated more varied CFU including mixed hematoendothelial (MIXED-HE), primitive erythroid (EryP), definitive erythroid (CFU-e-d), and macrophage (M-CFC) colonies. At both days 9 and 14, hematopoietic CFU progenitor activity was greater in CD34-BB9+ than in CD34+BB9+ populations; at Day 14 this represented approximately 6% of CD34+BB9+ cells, and approximately 10% of CD34−BB9+ cells. (E,F) Definitive hematopoietic differentiation of these same populations on OP9 stroma with erythromyeloid GFs. Both CD34+BB9+ and CD34-BB9+ (but not CD34−BB9−) fractions produced robust definitive hematopoietic potential, but CD235a+/CD45+CD13+CD15+ definitive-type erythro-myeloid cells had a more robust proliferation in the CD34−BB9+ fraction.
Figure 6
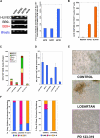
Blast colonies express RAS components that regulate their expansion and differentiation. (A) RNA was harvested from sorted hESC Line H1 day 9 BB9 + hEB (BB9+), day 9 BB9− hEB (BB9−), day 9 blast colonies (Blasts), or control human umbilical vein endothelial cells (HUVECs). Expression was assayed for actin, AGTR1, AGTR2, or angiotensinogen (AGTN) by qRT-PCR, as described in Document S1. Left panel demonstrates agarose gels of samples of PCR products (1/5 sample loaded) at linear amplification ranges for assayed transcripts. In right panel are relative, actin-normalized quantitative comparisons; fold change expression differences indicate levels of transcripts (calculated using the 2−ΔΔT method) of pooled day 9 blast colonies, compared with expression levels from sorted day 9 BB9+ hEB cells. (B) ACE enzymatic activity (units per number cultured cells assayed; mean ± SEM) was determined by colorimetric assay (in triplicate) from supernatants of pooled day 9 hEB blast colonies (BLASTS), or control supernatants from HUVEC (which express high levels of surface BB9/ACE (data not shown). (C) hEB were differentiated for hematopoietic progenitors (Figure S1A) in the presence or absence of specific RAS inhibitors. Captopril (100 μM; ACE inhibitor), 100 μM losartan (AGTR1 inhibitor), or 100 μM PD 123-319 (AGTR2 inhibitor) were included starting at day 4 of hEB culture. Day 14 hEB cell suspensions were assayed in duplicate in CFC assays, as before. (D) BL-CFC assays from days 5 to 9 hEB were conducted in the presence of supplemental angiotensin II peptide (ANG II; 100 μg/mL), captopril (100 μM), losartan (100 μM), or PD 123-319 (100 μM). Shown is the average of 2 independent experiments from day 9 hEB, with a similar pattern of results obtained with inhibitors in days 5 and 7 hEB BL-CFC assays (data not shown). (E,F) Blast colonies generated from day 5 or day 9 hEB cells were expanded in the presence of No inhibitor (control), 100 μM losartan, or 100 μM PD 123-319, and replated for secondary hematoendothelial CFC, as before. Although control blasts generated both hematopoietic and endothelial (HE) secondary progeny, the majority of blast colonies from losartan-treated blasts regenerated (robust) hematopoietic-only (H) progeny, whereas the majority of PD 123-319–treated blasts generated primarily endothelial-only (E) progeny. Shown panel F results are from blasts individually picked and replated blasts (n = 20 per condition), with typical secondary colony morphologies shown in panel E.
Figure 7
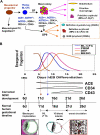
Scheme for the ontogeny of in vitro, hESC-derived hemangioblasts (A), and its congruence with the developmental timeline of normal human YS development (B). PC, progenitor cell; MESO, mesoderm progenitor; BL-CFC, hemangioblast progenitor; PRIM, primitive hematopoiesis; DEF, definitive (YS-like) hematopoiesis; PS, primitive streak; 2° YS, secondary yolk sac.
Comment in
- Renin-angiotensin system and hemangioblast development from human embryonic stem cells.
Slukvin II. Slukvin II. Expert Rev Hematol. 2009 Apr;2(2):137-43. doi: 10.1586/ehm.09.4. Expert Rev Hematol. 2009. PMID: 21083448
Similar articles
- Efficient and simultaneous generation of hematopoietic and vascular progenitors from human induced pluripotent stem cells.
Park TS, Zimmerlin L, Zambidis ET. Park TS, et al. Cytometry A. 2013 Jan;83(1):114-26. doi: 10.1002/cyto.a.22090. Epub 2012 Jun 26. Cytometry A. 2013. PMID: 22736485 Free PMC article. - Application of small molecule CHIR99021 leads to the loss of hemangioblast progenitor and increased hematopoiesis of human pluripotent stem cells.
Galat Y, Elcheva I, Dambaeva S, Katukurundage D, Beaman K, Iannaccone PM, Galat V. Galat Y, et al. Exp Hematol. 2018 Sep;65:38-48.e1. doi: 10.1016/j.exphem.2018.05.007. Epub 2018 Jun 5. Exp Hematol. 2018. PMID: 29879440 - Challenges and strategies for generating therapeutic patient-specific hemangioblasts and hematopoietic stem cells from human pluripotent stem cells.
Peters A, Burridge PW, Pryzhkova MV, Levine MA, Park TS, Roxbury C, Yuan X, Péault B, Zambidis ET. Peters A, et al. Int J Dev Biol. 2010;54(6-7):965-90. doi: 10.1387/ijdb.093043ap. Int J Dev Biol. 2010. PMID: 20563986 Free PMC article. Review. - Angiotensin-converting enzyme (CD143) specifies emerging lympho-hematopoietic progenitors in the human embryo.
Sinka L, Biasch K, Khazaal I, Péault B, Tavian M. Sinka L, et al. Blood. 2012 Apr 19;119(16):3712-23. doi: 10.1182/blood-2010-11-314781. Epub 2012 Jan 26. Blood. 2012. PMID: 22282502 - Towards the understanding of the local hematopoietic bone marrow renin-angiotensin system.
Haznedaroglu IC, Oztürk MA. Haznedaroglu IC, et al. Int J Biochem Cell Biol. 2003 Jun;35(6):867-80. doi: 10.1016/s1357-2725(02)00278-9. Int J Biochem Cell Biol. 2003. PMID: 12676173 Review.
Cited by
- Angiotensin II promotes differentiation of mouse c-kit-positive cardiac stem cells into pacemaker-like cells.
Xue C, Zhang J, Lv Z, Liu H, Huang C, Yang J, Wang T. Xue C, et al. Mol Med Rep. 2015 May;11(5):3249-58. doi: 10.3892/mmr.2015.3149. Epub 2015 Jan 7. Mol Med Rep. 2015. PMID: 25572000 Free PMC article. - Angiotensin II Regulation of Proliferation, Differentiation, and Engraftment of Hematopoietic Stem Cells.
Kim S, Zingler M, Harrison JK, Scott EW, Cogle CR, Luo D, Raizada MK. Kim S, et al. Hypertension. 2016 Mar;67(3):574-84. doi: 10.1161/HYPERTENSIONAHA.115.06474. Epub 2016 Jan 18. Hypertension. 2016. PMID: 26781279 Free PMC article. - Endothelial heterogeneity in bone marrow: insights across development, adult life and leukemia.
Boueya IL, Sandhow L, Albuquerque JRP, Znaidi R, Passaro D. Boueya IL, et al. Leukemia. 2025 Jan;39(1):8-24. doi: 10.1038/s41375-024-02453-x. Epub 2024 Nov 11. Leukemia. 2025. PMID: 39528790 Free PMC article. Review. - A modern understanding of the traditional and nontraditional biological functions of angiotensin-converting enzyme.
Bernstein KE, Ong FS, Blackwell WL, Shah KH, Giani JF, Gonzalez-Villalobos RA, Shen XZ, Fuchs S, Touyz RM. Bernstein KE, et al. Pharmacol Rev. 2012 Dec 20;65(1):1-46. doi: 10.1124/pr.112.006809. Print 2013 Jan. Pharmacol Rev. 2012. PMID: 23257181 Free PMC article. Review. - Engineering the human pluripotent stem cell microenvironment to direct cell fate.
Hazeltine LB, Selekman JA, Palecek SP. Hazeltine LB, et al. Biotechnol Adv. 2013 Nov 15;31(7):1002-19. doi: 10.1016/j.biotechadv.2013.03.002. Epub 2013 Mar 17. Biotechnol Adv. 2013. PMID: 23510904 Free PMC article. Review.
References
- Tavian M, Hallais MF, BPeault Emergence of intraembryonic hematopoietic precursors in the pre-liver human embryo. Development. 1999;126:793–803. - PubMed
- Bloom W, Bartelmez GW. Hematopoiesis in young human embryos. Am J Anat. 1940;67:21–53.
Publication types
MeSH terms
Substances
LinkOut - more resources
Full Text Sources
Other Literature Sources
Medical
Molecular Biology Databases
Research Materials
Miscellaneous
