TRP-ML1 functions as a lysosomal NAADP-sensitive Ca2+ release channel in coronary arterial myocytes - PubMed (original) (raw)
TRP-ML1 functions as a lysosomal NAADP-sensitive Ca2+ release channel in coronary arterial myocytes
Fan Zhang et al. J Cell Mol Med. 2009 Sep.
Abstract
Nicotinic acid adenine dinucleotide phosphate (NAADP) is a potent intracellular Ca(2+) signalling second messenger, but the mechanism of NAADP-induced Ca(2+) release is still poorly understood. The present study tested the hypothesis that NAADP induces Ca(2+) release from the lysosomal store via a TRP-ML1 (transient receptor potential-mucolipin 1)-mediated Ca(2+) release channel in coronary arterial myocytes (CAMs). RT-PCR and Western blot analyses demonstrated that TRP-ML1 was present in CAMs, and fluorescence resonance energy transfer (FRET) detection revealed that the TRP-ML1 was closely associated with some lysosomal proteins in these CAMs. ET-1, a well-known NAADP stimulator, was found to induce a local Ca(2+) burst from lysosomes followed by a global Ca(2+) release. This lysosome-associated Ca(2+) release was significantly inhibited in the TRP-ML1 siRNA pre-treated CAMs by 46.8 +/- 12.6% in the local Ca(2+) burst and 73.3 +/- 14.9% in the global Ca(2+) wave. In the reconstituted lysosomal channels from CAMs, NAADP activated Ca(2+) release channels at concentrations of 1-1000 nM, but neither activators (1 microM IP(3), 5 microM Rya) nor blockers (100 microM 2-APB, 50 microM Rya) of sarcoplasmic reticulum (SR) Ca(2+) release channels had effect on the channel activity. Moreover, TRP-ML1 gene silencing reduced this NAADP-sensitive Ca(2+) release channel activity in lysosomes by 71.5 +/- 18.5%. Immunoprecipitation or blockade of TRP-ML1 by anti-TRP-ML1 antibodies almost abolished NAADP-induced activation of lysosomal Ca(2+) channels (to 14.0 +/- 4.4% of control). These results for the first time provide direct evidence that an NAADP-sensitive Ca(2+) release channel is characteristic of TRP-ML1 channels.
Figures
Figure 1
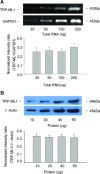
TRP-ML1 mRNA and protein expression in CAMs. (A) Representative gel document of RT-PCR products of TRP-ML1 and GAPDH at different initial RNA concentrations (upper panel). Summarized results in lower panel show normalized intensity ratio of TRP-ML1 to GAPDH. (B) Western blot gel document presents the level of TRP-ML1 and β-actin from CAMs homogenates at different concentrations (upper panel). Summarized results in lower panel show normalized intensity ratio of TRP-ML1 to β-Actin (_n_= 5 batches of cell preparations).
Figure 2
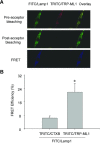
FRET detection of FITC-labelled Lamp-1 and TRITC-labelled TRP-ML1 in CAMs. In Figure 2A, the upper panel shows fluorescent images of a FITC/Lamp1 and TRITC/TRP-ML1 before acceptor bleaching (TRITC bleaching). The middle panel shows corresponding fluorescent images after acceptor bleaching. The bottom panel presents fluorescent images obtained by subtraction of post-bleaching images from pre-bleaching images (the middle panel minus the upper panel). Summarized results in Figure 2B showed that the FRET efficiency in TRITC/CTXB control group and TRITC/TRP-ML1 experimental group. *P < 0.05, significant difference from TRITC/CTXB group (_n_= 6).
Figure 3
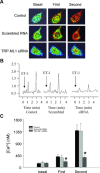
ET-1-induced Ca2+ release response in TRP-ML1 siRNA treated CAMs. (A) Serial images of fura-2 fluorescence ratio F340/F380 recorded in different treated CAMs. Spatially localized Ca2+ burst (first phase) around the cell boundary preceded global Ca2+ wave (second phase) in control and scrambled groups after ET-1 treatment with significantly blocking effects in TRP-ML1-siRNA group. (B) An online recording of fura-2 fluorescence ratio of F340 versus F380 (F340/F380) against time. (C) Summarized results. *P < 0.05 versus control or scrambled RNA group (_n_= 6).
Figure 4
Purity confirmation of lysosome preparations. Summarized results show the conversion rate of 4-nitrophenyl phosphate to 4-nitrophenyl by a lysosome marker enzyme, acid phosphatase in lysosomes (Lyso), sarcoplasmic reticulum (SR) and plasma membrane (PM), the reduction of cytochrome c by an E(S)R marker enzyme, NADPH cytochrome c reductase in the presence of NADPH and the conversion rate of sodium thymidine 5′-monophosphate _p_-nitrophenyl ester to _p_-nitrophenyl by a PM marker enzyme, alkaline phosphodiesterase. *P < 0.05, significant difference from other groups (_n_= 6 batches of lysosomal preparations).
Figure 5
Electrophysiological and pharmacological characterization of reconstituted lysosomal Ca2+ release channels. (A) Representative recording of NAADP-sensitive Ca2+ channel currents in the upper panel at holding potential of –40 to +40 mV. c: channel closed. Insert: scales of channel recording time (50 mS) and amplitude (10 pA). The bottom panel presents a current-voltage relationship of reconstituted lysosomal Ca2+-release channels with symmetrical cesium methanesulfonate (300 mM) solution. (B) The upper panel shows representative recordings of reconstituted lysosomal NAADP-sensitive Ca2+ release channels in the planar lipid bilayer under control condition or with treatment of NAADP. The bottom panel summarized _NP_o (open channel probability) when CAMs were treated with different concentrations of NAADP. ‘0.5 nM then 1 μM’ means pretreatment of the bilayer with subthreshold NAADP (0.5 nM) followed by a high dose of NAADP (1 μM). *P < 0.05, significant difference from control group (_n_= 6).
Figure 6
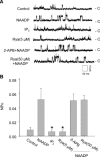
Effects of IP3R or RyR agonist and antagonist on the activity of reconstituted lysosomal Ca2+ release channels. (A) Representative recordings of channel currents under control condition and after addition of NAADP (100 nM), IP3 (1 μM) and Rya (5 μM) or pretreated with 2-APB (100 μM) or Rya (50 μM) followed by NAADP (100 nM) into the cis solution. (B) Summarized channel open probability (NPo) at different treatments. *P < 0.05 compared with NAADP alone group (_n_= 6).
Figure 7
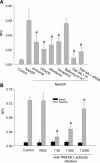
Identification of lysosomal NAADP-sensitive Ca2+ release channels as TRP-ML1 function by reconstituted lipid bilayer assay. (A) Summarized results show that the channel open probability (NPo) is under control condition and by treatment of bilayer with 100 nM NAADP before and after pretreatment of amiloride (1 mM), PPADS (50 μM), nifedipine (100 μM), verapamil(100 μM), bafilomycin A1(100 nM) and TRP-ML1 siRNA or immunoprecipitation of TRP-ML1 by anti-TRP-ML1 antibody (ab28508, Abcam). (B) Summarized results show that the NAADP-induced channel NPo is under control condition, by treatment of bilayer with normal goat serum (NGS) or after anti-TRP-ML1 antibody (sc-26269, Santa Cruz Biotechnology, Inc.) addition, respectively. #P < 0.05 compared with NAADP alone group; *P < 0.05 compared with control or NGS-treated group (_n_= 6).
Similar articles
- Intracellular two-phase Ca2+ release and apoptosis controlled by TRP-ML1 channel activity in coronary arterial myocytes.
Xu M, Li X, Walsh SW, Zhang Y, Abais JM, Boini KM, Li PL. Xu M, et al. Am J Physiol Cell Physiol. 2013 Mar 1;304(5):C458-66. doi: 10.1152/ajpcell.00342.2012. Epub 2013 Jan 2. Am J Physiol Cell Physiol. 2013. PMID: 23283937 Free PMC article. - Reconstitution of lysosomal NAADP-TRP-ML1 signaling pathway and its function in TRP-ML1(-/-) cells.
Zhang F, Xu M, Han WQ, Li PL. Zhang F, et al. Am J Physiol Cell Physiol. 2011 Aug;301(2):C421-30. doi: 10.1152/ajpcell.00393.2010. Epub 2011 May 25. Am J Physiol Cell Physiol. 2011. PMID: 21613607 Free PMC article. - Reconstitution and characterization of a nicotinic acid adenine dinucleotide phosphate (NAADP)-sensitive Ca2+ release channel from liver lysosomes of rats.
Zhang F, Li PL. Zhang F, et al. J Biol Chem. 2007 Aug 31;282(35):25259-69. doi: 10.1074/jbc.M701614200. Epub 2007 Jul 3. J Biol Chem. 2007. PMID: 17613490 - Linking NAADP to ion channel activity: a unifying hypothesis.
Guse AH. Guse AH. Sci Signal. 2012 Apr 24;5(221):pe18. doi: 10.1126/scisignal.2002890. Sci Signal. 2012. PMID: 22534131 Review. - Modulation of Calcium Entry by the Endo-lysosomal System.
Brailoiu GC, Brailoiu E. Brailoiu GC, et al. Adv Exp Med Biol. 2016;898:423-47. doi: 10.1007/978-3-319-26974-0_18. Adv Exp Med Biol. 2016. PMID: 27161239 Review.
Cited by
- Defective autophagosome trafficking contributes to impaired autophagic flux in coronary arterial myocytes lacking CD38 gene.
Zhang Y, Xu M, Xia M, Li X, Boini KM, Wang M, Gulbins E, Ratz PH, Li PL. Zhang Y, et al. Cardiovasc Res. 2014 Apr 1;102(1):68-78. doi: 10.1093/cvr/cvu011. Epub 2014 Jan 20. Cardiovasc Res. 2014. PMID: 24445604 Free PMC article. - Lysosomal size matters.
de Araujo MEG, Liebscher G, Hess MW, Huber LA. de Araujo MEG, et al. Traffic. 2020 Jan;21(1):60-75. doi: 10.1111/tra.12714. Epub 2019 Dec 6. Traffic. 2020. PMID: 31808235 Free PMC article. Review. - Lysosomal TRPML1 Channel: Implications in Cardiovascular and Kidney Diseases.
Li G, Li PL. Li G, et al. Adv Exp Med Biol. 2021;1349:275-301. doi: 10.1007/978-981-16-4254-8_13. Adv Exp Med Biol. 2021. PMID: 35138619 Free PMC article. - Regulation of dynein-mediated autophagosomes trafficking by ASM in CASMCs.
Xu M, Zhang Q, Li PL, Nguyen T, Li X, Zhang Y. Xu M, et al. Front Biosci (Landmark Ed). 2016 Jan 1;21(4):696-706. doi: 10.2741/4415. Front Biosci (Landmark Ed). 2016. PMID: 26709800 Free PMC article. - Lysosomal cholesterol accumulation in macrophages leading to coronary atherosclerosis in CD38(-/-) mice.
Xu X, Yuan X, Li N, Dewey WL, Li PL, Zhang F. Xu X, et al. J Cell Mol Med. 2016 Jun;20(6):1001-13. doi: 10.1111/jcmm.12788. Epub 2016 Jan 28. J Cell Mol Med. 2016. PMID: 26818887 Free PMC article.
References
- Lee HC. Physiological functions of cyclic ADP-ribose and NAADP as calcium messengers. Annu Rev Pharmacol Toxicol. 2001;41:317–45. - PubMed
- Bezin S, Charpentier G, Fossier P, et al. The Ca2+-releasing messenger NAADP, a new player in the nervous system. J Physiol Paris. 2006;99:111–8. - PubMed
- Aarhus R, Graeff RM, Dickey DM, et al. ADP-ribosyl cyclase and CD38 catalyze the synthesis of a calcium-mobilizing metabolite from NADP. J Biol Chem. 1995;270:30327–33. - PubMed
- Yamasaki M, Churchill GC, Galione A. Calcium signalling by nicotinic acid adenine dinucleotide phosphate (NAADP) FEBS J. 2005;272:4598–606. - PubMed
- Dammermann W, Guse AH. Functional ryanodine receptor expression is required for NAADP-mediated local Ca2+ signaling in T-lymphocytes. J Biol Chem. 2005;280:21394–9. - PubMed
Publication types
MeSH terms
Substances
Grants and funding
- DK54927/DK/NIDDK NIH HHS/United States
- R01 HL091464/HL/NHLBI NIH HHS/United States
- HL-75316/HL/NHLBI NIH HHS/United States
- R01 HL075316/HL/NHLBI NIH HHS/United States
- R01 HL057244/HL/NHLBI NIH HHS/United States
- HL-57244/HL/NHLBI NIH HHS/United States
- R29 HL057244/HL/NHLBI NIH HHS/United States
- R01 DK054927/DK/NIDDK NIH HHS/United States
LinkOut - more resources
Full Text Sources
Research Materials
Miscellaneous
