Silencing of cytosolic or mitochondrial isoforms of malic enzyme has no effect on glucose-stimulated insulin secretion from rodent islets - PubMed (original) (raw)
. 2008 Oct 24;283(43):28909-17.
doi: 10.1074/jbc.M804665200. Epub 2008 Aug 28.
Mette V Jensen, Hans E Hohmeier, Shawn C Burgess, Yun-Ping Zhou, Su Qian, Douglas MacNeil, Andrew Howard, Nancy Thornberry, Olga Ilkayeva, Danhong Lu, A Dean Sherry, Christopher B Newgard
Affiliations
- PMID: 18755687
- PMCID: PMC2570884
- DOI: 10.1074/jbc.M804665200
Silencing of cytosolic or mitochondrial isoforms of malic enzyme has no effect on glucose-stimulated insulin secretion from rodent islets
Sarah M Ronnebaum et al. J Biol Chem. 2008.
Abstract
We have previously demonstrated a role for pyruvate cycling in glucose-stimulated insulin secretion (GSIS). Some of the possible pyruvate cycling pathways are completed by conversion of malate to pyruvate by malic enzyme. Using INS-1-derived 832/13 cells, it has recently been shown by other laboratories that NADP-dependent cytosolic malic enzyme (MEc), but not NAD-dependent mitochondrial malic enzyme (MEm), regulates GSIS. In the current study, we show that small interfering RNA-mediated suppression of either MEm or MEc results in decreased GSIS in both 832/13 cells and a new and more glucose- and incretin-responsive INS-1-derived cell line, 832/3. The effect of MEm to suppress GSIS in these cell lines was linked to a substantial decrease in cell growth, whereas MEc suppression resulted in decreased NADPH, shown previously to be correlated with GSIS. However, adenovirus-mediated delivery of small interfering RNAs specific to MEc and MEm to isolated rat islets, while leading to effective suppression of the targets transcripts, had no effect on GSIS. Furthermore, islets isolated from MEc-null MOD1(-/-) mice exhibit normal glucose- and potassium-stimulated insulin secretion. These results indicate that pyruvate-malate cycling does not control GSIS in primary rodent islets.
Figures
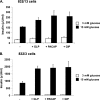
FIGURE 1.
Characterization of INS-1-derived 832/13 and 832/3 cell lines. Glucose-stimulated insulin secretion was measured in 832/13 (A) and 832/3 (B) cells at 3 and 15 m
m
glucose in the presence or absence of 50 n
m
GLP-1, 50 n
m
PACAP, or 50 n
m
GIP. The data represent the means ± S.E. of three independent measurements and are representative of three other independent experiments.
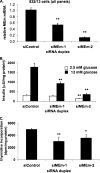
FIGURE 2.
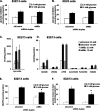
Suppression of MEm expression in 832/13 cells impairs GSIS and cell proliferation. A, 832/13 cells were transfected with an siRNA with no known target (siControl) or two independent siRNAs targeting MEm, and the levels of MEm RNA were measured via RT-PCR. B, following 72 h of culture, GSIS was measured in 832/13 cells transfected with MEm or siControl siRNA duplexes and normalized to total protein content. C, [methyl-3H]thymidine incorporation was measured in 832/13 cells transfected with MEm or siControl siRNA duplexes, and the data were normalized to total protein content. For all three panels, the results represent the means ± S.E. of three independent experiments. *, p < 0.05; **, p < 0.005.
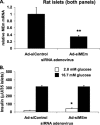
FIGURE 3.
Adenovirus-mediated suppression of MEm expression in rat islets does not impair GSIS. A, MEm siRNA siMEm-2 was cloned into a recombinant adenovirus and used to transduce isolated rat islets. MEm mRNA was measured by RT-PCR. B, GSIS was measured in isolated rat islets treated with Ad-siControl or Ad-siMEm adenoviruses and normalized to islet number. For both panels, the results represent the means ± S.E. of three independent experiments. *, p < 0.05; **, p < 0.005.
FIGURE 4.
Suppression of MEc expression impairs GSIS in 832/13 and 832/3 cells. An siRNA targeting MEc (siMEc) or siControl was transfected into 832/13 cells and 832/3 cells, respectively. Following 72 h of culture, MEc mRNA was measured via RT-PCR (832/13 (A) and 832/3 cells (C)), and GSIS was measured and normalized to total cellular protein (832/13 (B) and 832/3 cells (D)). The results represent the means ± S.E. of three independent experiments. *, p < 0.05; **, p < 0.005.
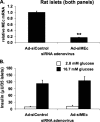
FIGURE 5.
Suppression of MEc expression does not impair GSIS in rat islets. An adenovirus containing siMEc (Ad-siMEc) or a control adenovirus containing an siRNA with no known target (Ad-siControl) was used to transduce isolated rat islets. MEc mRNA was measured (A), and insulin secretion at 2.8 and 16.7 m
m
glucose was normalized to islet number (B). The results represent the means ± S.E. of three independent experiments. *,p < 0.05; **, p < 0.005.
FIGURE 6.
Metabolic effects of suppression of MEc expression in 832/13 and 832/3 cells. 832/13 or 832/3 cells were transfected with siMEc or siControl siRNA duplexes. [U-14C]Glucose oxidation to CO2 was measured at 2.5 and 12 m
m
glucose in 832/13 cells (A) and 832/3 cells (B), and the data were normalized to total cellular protein. C and D, pyruvate (C) and other organic acids (D) were measured at 2.5 and 12 m
m
glucose by gas chromatography/mass spectrometry in 832/13 cells and normalized to total cellular protein. E, NADPH was measured at 2.5 and 12 m
m
glucose in 832/13 cells and normalized to total cellular protein. F, [U-14C]glucose incorporation into lipids was measured at 2.5 and 12 m
m
glucose and normalized to total cellular protein. The results in all of the panels represent the means ± S.E. of three independent experiments. *, p < 0.05.
FIGURE 7.
Suppression of MEc in 832/13 cells has no effect on pyruvate cycling. 832/13 cells were transfected with siMEc or siControl siRNA duplexes. Following 72 h of culture, the cells were incubated in 2.5 or 12 m
m
[U-13C]glucose for 3 h. Cell extracts were collected, and pyruvate cycling was measured via NMR-based mass isotopomer analysis. The results represent the means ± S.E. of five independent experiments.
FIGURE 8.
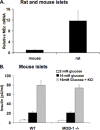
Expression of MEc in mouse and rat islets and lack of effect of MEc deletion on GSIS in mouse islets. Islets were isolated from Wistar rats and from wild type (WT) and MOD1–/– mice.A, RNA was harvested, and MEc expression was measured in islets from Wistar rats and wild type mice by RT-PCR. The data are expressed relative to MEc expression in mouse islets, using an identical internal standard (cyclophilin) for both the rat and mouse RNA samples, and mouse and rat-specific MEc primers with similar binding affinities. B, insulin secretion was measured in wild type and MOD1–/– mouse islets in response to 2 m
m
glucose, 16 m
m
glucose, and 16 m
m
glucose plus 30 m
m
KCl. The results in all of the panels represent the means ± S.E. of three independent experiments.
Similar articles
- Cytosolic and mitochondrial malic enzyme isoforms differentially control insulin secretion.
Pongratz RL, Kibbey RG, Shulman GI, Cline GW. Pongratz RL, et al. J Biol Chem. 2007 Jan 5;282(1):200-7. doi: 10.1074/jbc.M602954200. Epub 2006 Nov 13. J Biol Chem. 2007. PMID: 17102138 - The dicarboxylate carrier plays a role in mitochondrial malate transport and in the regulation of glucose-stimulated insulin secretion from rat pancreatic beta cells.
Huypens P, Pillai R, Sheinin T, Schaefer S, Huang M, Odegaard ML, Ronnebaum SM, Wettig SD, Joseph JW. Huypens P, et al. Diabetologia. 2011 Jan;54(1):135-45. doi: 10.1007/s00125-010-1923-5. Epub 2010 Oct 15. Diabetologia. 2011. PMID: 20949348 - Role for malic enzyme, pyruvate carboxylation, and mitochondrial malate import in glucose-stimulated insulin secretion.
Heart E, Cline GW, Collis LP, Pongratz RL, Gray JP, Smith PJ. Heart E, et al. Am J Physiol Endocrinol Metab. 2009 Jun;296(6):E1354-62. doi: 10.1152/ajpendo.90836.2008. Epub 2009 Mar 17. Am J Physiol Endocrinol Metab. 2009. PMID: 19293334 Free PMC article. - Stimulus/secretion coupling factors in glucose-stimulated insulin secretion: insights gained from a multidisciplinary approach.
Newgard CB, Lu D, Jensen MV, Schissler J, Boucher A, Burgess S, Sherry AD. Newgard CB, et al. Diabetes. 2002 Dec;51 Suppl 3:S389-93. doi: 10.2337/diabetes.51.2007.s389. Diabetes. 2002. PMID: 12475781 Review. - Metabolic cycling in control of glucose-stimulated insulin secretion.
Jensen MV, Joseph JW, Ronnebaum SM, Burgess SC, Sherry AD, Newgard CB. Jensen MV, et al. Am J Physiol Endocrinol Metab. 2008 Dec;295(6):E1287-97. doi: 10.1152/ajpendo.90604.2008. Epub 2008 Aug 26. Am J Physiol Endocrinol Metab. 2008. PMID: 18728221 Free PMC article. Review.
Cited by
- Hetero-bivalent GLP-1/glibenclamide for targeting pancreatic β-cells.
Hart NJ, Chung WJ, Weber C, Ananthakrishnan K, Anderson M, Patek R, Zhang Z, Limesand SW, Vagner J, Lynch RM. Hart NJ, et al. Chembiochem. 2014 Jan 3;15(1):135-45. doi: 10.1002/cbic.201300375. Epub 2013 Nov 20. Chembiochem. 2014. PMID: 24259278 Free PMC article. - Phosphoenolpyruvate cycling via mitochondrial phosphoenolpyruvate carboxykinase links anaplerosis and mitochondrial GTP with insulin secretion.
Stark R, Pasquel F, Turcu A, Pongratz RL, Roden M, Cline GW, Shulman GI, Kibbey RG. Stark R, et al. J Biol Chem. 2009 Sep 25;284(39):26578-90. doi: 10.1074/jbc.M109.011775. Epub 2009 Jul 27. J Biol Chem. 2009. PMID: 19635791 Free PMC article. - Adenylosuccinate Is an Insulin Secretagogue Derived from Glucose-Induced Purine Metabolism.
Gooding JR, Jensen MV, Dai X, Wenner BR, Lu D, Arumugam R, Ferdaoussi M, MacDonald PE, Newgard CB. Gooding JR, et al. Cell Rep. 2015 Oct 6;13(1):157-167. doi: 10.1016/j.celrep.2015.08.072. Epub 2015 Sep 24. Cell Rep. 2015. PMID: 26411681 Free PMC article. - Mechanisms controlling pancreatic islet cell function in insulin secretion.
Campbell JE, Newgard CB. Campbell JE, et al. Nat Rev Mol Cell Biol. 2021 Feb;22(2):142-158. doi: 10.1038/s41580-020-00317-7. Epub 2021 Jan 4. Nat Rev Mol Cell Biol. 2021. PMID: 33398164 Free PMC article. Review. - Lower succinyl-CoA:3-ketoacid-CoA transferase (SCOT) and ATP citrate lyase in pancreatic islets of a rat model of type 2 diabetes: knockdown of SCOT inhibits insulin release in rat insulinoma cells.
Hasan NM, Longacre MJ, Seed Ahmed M, Kendrick MA, Gu H, Ostenson CG, Fukao T, MacDonald MJ. Hasan NM, et al. Arch Biochem Biophys. 2010 Jul;499(1-2):62-8. doi: 10.1016/j.abb.2010.05.007. Epub 2010 May 9. Arch Biochem Biophys. 2010. PMID: 20460097 Free PMC article.
References
- Gunawardana, S. C., Liu, Y. J., Macdonald, M. J., Straub, S. G., and Sharp, G. W. (2004) Am. J. Physiol. 287 E828–E833 - PubMed
- Muoio, D. M., and Newgard, C. B. (2008) Nat. Rev. Mol. Cell. Biol. 9 193–205 - PubMed
- Henquin, J. C., Ravier, M. A., Nenquin, M., Jonas, J. C., and Gilon, P. (2003) Eur. J. Clin. Investig. 33 742–750 - PubMed
- Khan, A., Ling, Z. C., and Landau, B. R. (1996) J. Biol. Chem. 271 2539–2542 - PubMed
Publication types
MeSH terms
Substances
LinkOut - more resources
Full Text Sources
Medical
Research Materials
Miscellaneous
