A systematic methodology for defining coarse-grained sites in large biomolecules - PubMed (original) (raw)
A systematic methodology for defining coarse-grained sites in large biomolecules
Zhiyong Zhang et al. Biophys J. 2008 Dec.
Abstract
Coarse-grained (CG) models of biomolecules have recently attracted considerable interest because they enable the simulation of complex biological systems on length-scales and timescales that are inaccessible for atomistic molecular dynamics simulation. A CG model is defined by a map that transforms an atomically detailed configuration into a CG configuration. For CG models of relatively small biomolecules or in cases that the CG and all-atom models have similar resolution, the construction of this map is relatively straightforward and can be guided by chemical intuition. However, it is more challenging to construct a CG map when large and complex domains of biomolecules have to be represented by relatively few CG sites. This work introduces a new and systematic methodology called essential dynamics coarse-graining (ED-CG). This approach constructs a CG map of the primary sequence at a chosen resolution for an arbitrarily complex biomolecule. In particular, the resulting ED-CG method variationally determines the CG sites that reflect the essential dynamics characterized by principal component analysis of an atomistic molecular dynamics trajectory. Numerical calculations illustrate this approach for the HIV-1 CA protein dimer and ATP-bound G-actin. Importantly, since the CG sites are constructed from the primary sequence of the biomolecule, the resulting ED-CG model may be better suited to appropriately explore protein conformational space than those from other CG methods at the same degree of resolution.
Figures
FIGURE 1
(a) The first PCA mode of the HIV-1 CA protein dimer. A 20-ns atomistic trajectory was used, and only the 440 Cα atoms were considered to perform the PCA. There are dynamic domains in which atoms move highly correlated. (b) Schematic diagram illustrating the ED-CG algorithm. The N- and C-terminus are fixed, and in this case there are three boundary atoms to determine four sequentially contiguous domains. Each CG site is the COM of a domain. The minimal residual (Eq. 5) can be obtained by adjusting the positions of the boundary atoms (as illustrated by the arrow), and the locations of the CG sites are adjusted accordingly.
FIGURE 2
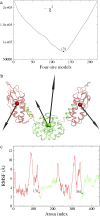
Four-site models of the HIV-1 CA protein dimer: (a) The residuals (Eq. 5) of all the symmetric four-site models, and the boundary atom for the model with the minimal residual is 131. (b) The ED-CG four-site model, and the four dynamic domains are (1–131) red; (132–220) green; (221–351) red; and (352–440) green. Each CG site is the COM of its corresponding domain, and the arrows on the sites indicate the first PCA mode of a four-site coarse-grained trajectory that was constructed from the atomistic MD trajectory. (c) The RMSF values of Cα atoms in the essential subspace (_n_ED = 6). The four dynamic domains obtained by the ED-CG method are mapped onto the RMSF curve with colors corresponding to panel b, and the boundary atoms are labeled.
FIGURE 3
(a) The symmetric ED-CG six-site model of the HIV-1 CA protein dimer. The six dynamic domains are (1–72) blue; (73–134) red; (135–220) green; (221–292) blue; (293–354) red; and (355–440) green. (b) The RMSF values of Cα atoms in the essential subspace (_n_ED = 12). The six dynamic domains obtained by the ED-CG method are mapped onto the RMSF curve with colors corresponding to panel a, and the boundary atoms are labeled. (c) The symmetric ED-CG eight-site model of the HIV-1 CA protein dimer. The eight dynamic domains are (1–23) orange; (24–75) blue; (76–134) red; (135–220) green; (221–243) orange; (244–295) blue; (296–354) red; and (355–440) green. (d) The RMSF values of Cα atoms in the essential subspace (_n_ED = 18). The eight dynamic domains obtained by the ED-CG method are mapped onto the RMSF curve with colors corresponding to panel c, and the boundary atoms are labeled. In each model, each CG site is the COM of its corresponding domain, and the arrows on the sites indicate the first PCA mode from the coarse-grained trajectory that was constructed from the atomistic MD trajectory.
FIGURE 4
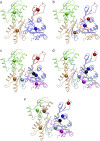
Different CG models of ATP-bound G-actin. (a) The intuitive four-site model: D1 (1–32, 70–144, 338–375), blue; D2 (33–69), red; D3 (145–180, 270–337), orange; and D4 (181–269), green. (b) The ED-CG four-site model: (1–51), red; (52–173), blue; (174–273), green; and (274–375), orange. (c) The intuitive seven-site model: (1–32), black; (33–69), red; (70–144), blue; (145–180), cyan; (181–269), green; (270–337), orange; and (338–375), magenta. (d) The ED-CG seven-site model: (1–37), black; (38–51), red; (52–115), blue; (116–191), cyan; (192–252), green; (253–324), orange; and (325–375), magenta. (e) The ED-CG eight-site model: (1–37), black; (38–51), red; (52–107), blue; (108–172), cyan; (173–223), ocher; (224–272), green; (273–334), orange; and (335–375), magenta. Each CG site is the COM of its corresponding dynamic domain.
FIGURE 5
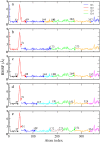
The CG models of ATP-bound G-actin mapped onto the RMSF curve of Cα atoms in the essential subspace. (a) The intuitive four-site model. The four subdomains (D1–D4) are labeled, which consist of seven contiguous domains. The colors of the domains correspond to Fig. 4 a. The number of essential PCA modes is _n_ED = 6. (b) The ED-CG four-site model. The four dynamic domains are colored corresponding to Fig. 4 b. _n_ED = 6. (c) The intuitive seven-site model. The seven domains, which are the same as those in the intuitive four-site model (a), are colored corresponding to Fig. 4 c. _n_ED = 15. (d) The ED-CG seven-site model. The seven dynamic domains are colored corresponding to Fig. 4 d. _n_ED = 15. (e) The ED-CG eight-site model. The eight dynamic domains are colored corresponding to Fig. 4 e. _n_ED = 18. The boundary atoms are labeled in each CG model.
FIGURE 6
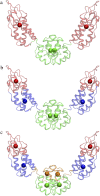
The TRN-CG models of the HIV-1 CA protein dimer. (a) The four-site model, (b) the six-site model, and (c) the eight-site model. In the TRN-CG method, a CG site is placed first, and then a domain is determined that contains a set of atoms such that every atom in this set is closer to the corresponding site than to any other site.
FIGURE 7
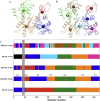
The TRN-CG models of ATP-bound G-actin. (a) The four-site model, (b) the seven-site model, and (c) the allocation of domains in the different CG models. The x axis is the residue number of the protein, and the y axis represents the different CG models. The four subdomains (D1–D4) used in the literature (13,14) are indicated in the intuitive four-site model. The dynamic domains in the ED-CG models are colored corresponding to Fig. 4. The DB-loop region (residues 40–48) is marked with a vertical gray box.
Similar articles
- Defining coarse-grained representations of large biomolecules and biomolecular complexes from elastic network models.
Zhang Z, Pfaendtner J, Grafmüller A, Voth GA. Zhang Z, et al. Biophys J. 2009 Oct 21;97(8):2327-37. doi: 10.1016/j.bpj.2009.08.007. Biophys J. 2009. PMID: 19843465 Free PMC article. - _K_-Means Clustering Coarse-Graining (KMC-CG): A Next Generation Methodology for Determining Optimal Coarse-Grained Mappings of Large Biomolecules.
Wu J, Xue W, Voth GA. Wu J, et al. J Chem Theory Comput. 2023 Dec 12;19(23):8987-8997. doi: 10.1021/acs.jctc.3c01053. Epub 2023 Nov 13. J Chem Theory Comput. 2023. PMID: 37957028 Free PMC article. - Systematic methods for defining coarse-grained maps in large biomolecules.
Zhang Z. Zhang Z. Adv Exp Med Biol. 2015;827:33-48. doi: 10.1007/978-94-017-9245-5_4. Adv Exp Med Biol. 2015. PMID: 25387958 - Recent Advances in Coarse-Grained Models for Biomolecules and Their Applications.
Singh N, Li W. Singh N, et al. Int J Mol Sci. 2019 Aug 1;20(15):3774. doi: 10.3390/ijms20153774. Int J Mol Sci. 2019. PMID: 31375023 Free PMC article. Review. - Modeling Structural Dynamics of Biomolecular Complexes by Coarse-Grained Molecular Simulations.
Takada S, Kanada R, Tan C, Terakawa T, Li W, Kenzaki H. Takada S, et al. Acc Chem Res. 2015 Dec 15;48(12):3026-35. doi: 10.1021/acs.accounts.5b00338. Epub 2015 Nov 17. Acc Chem Res. 2015. PMID: 26575522 Review.
Cited by
- Coarse-graining provides insights on the essential nature of heterogeneity in actin filaments.
Fan J, Saunders MG, Voth GA. Fan J, et al. Biophys J. 2012 Sep 19;103(6):1334-42. doi: 10.1016/j.bpj.2012.08.029. Biophys J. 2012. PMID: 22995506 Free PMC article. - Accelerated Lignocellulosic Molecule Adsorption Structure Determination.
Jestilä JS, Wu N, Priante F, Foster AS. Jestilä JS, et al. J Chem Theory Comput. 2024 Mar 12;20(5):2297-2312. doi: 10.1021/acs.jctc.3c01292. Epub 2024 Feb 26. J Chem Theory Comput. 2024. PMID: 38408381 Free PMC article. - Utilizing Machine Learning to Greatly Expand the Range and Accuracy of Bottom-Up Coarse-Grained Models through Virtual Particles.
Sahrmann PG, Loose TD, Durumeric AEP, Voth GA. Sahrmann PG, et al. J Chem Theory Comput. 2023 Jul 25;19(14):4402-4413. doi: 10.1021/acs.jctc.2c01183. Epub 2023 Feb 20. J Chem Theory Comput. 2023. PMID: 36802592 Free PMC article. - Unusual Organization of I-BAR Proteins on Tubular and Vesicular Membranes.
Jarin Z, Tsai FC, Davtyan A, Pak AJ, Bassereau P, Voth GA. Jarin Z, et al. Biophys J. 2019 Aug 6;117(3):553-562. doi: 10.1016/j.bpj.2019.06.025. Epub 2019 Jul 2. Biophys J. 2019. PMID: 31349990 Free PMC article. - Inositol Hexakisphosphate (IP6) Accelerates Immature HIV-1 Gag Protein Assembly toward Kinetically Trapped Morphologies.
Pak AJ, Gupta M, Yeager M, Voth GA. Pak AJ, et al. J Am Chem Soc. 2022 Jun 15;144(23):10417-10428. doi: 10.1021/jacs.2c02568. Epub 2022 Jun 6. J Am Chem Soc. 2022. PMID: 35666943 Free PMC article.
References
- Karplus, M., and J. A. McCammon. 2002. Molecular dynamics simulations of biomolecules. Nat. Struct. Biol. 9:646–652. - PubMed
- Tozzini, V. 2005. Coarse-grained models of proteins. Curr. Opin. Struct. Biol. 15:144–150. - PubMed
- Ayton, G. S., W. G. Noid, and G. A. Voth. 2007. Multiscale modeling of biomolecular systems: in serial and in parallel. Curr. Opin. Struct. Biol. 17:192–198. - PubMed
- Izvekov, S., and G. A. Voth. 2005. A multiscale coarse-graining method for biomolecular systems. J. Phys. Chem. B. 109:2469–2473. - PubMed
Publication types
MeSH terms
Substances
LinkOut - more resources
Full Text Sources

