Linear motif atlas for phosphorylation-dependent signaling - PubMed (original) (raw)
doi: 10.1126/scisignal.1159433.
Lars Juhl Jensen, Francesca Diella, Claus Jørgensen, Michele Tinti, Lei Li, Marilyn Hsiung, Sirlester A Parker, Jennifer Bordeaux, Thomas Sicheritz-Ponten, Marina Olhovsky, Adrian Pasculescu, Jes Alexander, Stefan Knapp, Nikolaj Blom, Peer Bork, Shawn Li, Gianni Cesareni, Tony Pawson, Benjamin E Turk, Michael B Yaffe, Søren Brunak, Rune Linding
Affiliations
- PMID: 18765831
- PMCID: PMC6215708
- DOI: 10.1126/scisignal.1159433
Linear motif atlas for phosphorylation-dependent signaling
Martin Lee Miller et al. Sci Signal. 2008.
Abstract
Systematic and quantitative analysis of protein phosphorylation is revealing dynamic regulatory networks underlying cellular responses to environmental cues. However, matching these sites to the kinases that phosphorylate them and the phosphorylation-dependent binding domains that may subsequently bind to them remains a challenge. NetPhorest is an atlas of consensus sequence motifs that covers 179 kinases and 104 phosphorylation-dependent binding domains [Src homology 2 (SH2), phosphotyrosine binding (PTB), BRCA1 C-terminal (BRCT), WW, and 14-3-3]. The atlas reveals new aspects of signaling systems, including the observation that tyrosine kinases mutated in cancer have lower specificity than their non-oncogenic relatives. The resource is maintained by an automated pipeline, which uses phylogenetic trees to structure the currently available in vivo and in vitro data to derive probabilistic sequence models of linear motifs. The atlas is available as a community resource (http://netphorest.info).
Figures
Fig. 1
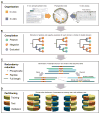
Tree-based organization, redundancy reduction, and partitioning of data. (A) All available data from in vivo and in vitro experiments for kinase, SH2, and PTB domains are organized by mapping them onto the phylogenetic domain trees. (B) The tree data structure enables us to automatically compile a data set of positive and negative examples for each domain or family of related domains. For a given domain (leafs in the tree) or domain family (branch points in the tree), we exclude phosphorylation sites that cannot be unambiguously designated as positive or negative examples, because they were annotated at a higher level in the tree. (C) Redundant phosphoproteins and phosphorylation sites are identified and eliminated on the basis of sequence similarity of the full-length protein sequence or the phosphorylation sites themselves. (D) Each redundancy-reduced data set is partitioned into four parts that are used for training, test, and validation of ANNs. See fig. S1 for a flowchart of the pipeline, fig. S2 for an overview of the data coverage, and Methods for details.
Fig. 2
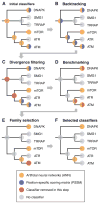
Selection of classifiers using the phosphoinositide 3-kinase-related kinase (PIKK) family of kinases as an example. (A) ANNs are trained for individual domains, subfamilies, and families of domains; by contrast, the PSSMs are initially assigned to the specific domain with which the in vitro assay was performed. (B) As some PSSMs (for example, the one for ATM) may be better used as classifiers for a subfamily of closely related kinases (for example, ATM/ATR), we backtrack all PSSMs toward the root of the tree. (C) We eliminate families that contain domains that are highly dissimilar from each other (for example, the PIKK family and the ATM/ATR/mTOR subfamily), in order not to describe highly divergent domains with the same ANNs and PSSMs (see Methods). (D) Whenever possible, we benchmark the ANNs and PSSMs and discard classifiers that do not perform significantly better than random expectation. (E) A nonredundant set of classifiers is selected that maximizes the average AROC across all kinases, SH2 domains, or PTB domains. (F) For the PIKK family of kinases, this procedure selects the ANNs for the ATM/ATR subfamily, mTOR, and DNA-dependent protein kinase (DNAPK) to be the best combination of classifiers. See fig. S3 for an overview of the current selection of classifiers.
Fig. 3
Overview of the performance of the NetPhorest classifiers. The histogram shows the distribution of areas under the receiver operating characteristic curves (AROCs). More than 60% of the classifiers have AROC > 0.75 (see table S1 for the complete list of AROCs and fig. S8 or
for the collection of ROCs).
Fig. 4
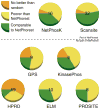
Comparison of NetPhorest to other motif resources. We compared NetPhorest to Scansite (13) and the sequence patterns of ELM (14), PROSITE (19), and HPRD (18) using the entire compilation of phosphorylation sites. For NetPhosK (20), GPS (22), and KinasePhos (24), we used only the subset of sites that was dissimilar in sequence to those used to train classifiers of NetPhorest (see Methods for details). When at least five positive examples were left, the AROC was calculated. Subsequently, we tested how many of the predictors from each method performed no better than random, better than random but significantly poorer than NetPhorest, or comparable to NetPhorest. No predictor from any of the tested methods performed significantly better than the corresponding NetPhorest classifier. The number on each pie chart specifies how many predictors were tested from the method in question (see table S2 for details). Because classifiers from NetPhosK and Scansite were included in NetPhorest, those two resources are shown above the dotted line.
Fig. 5
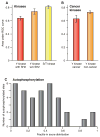
Weak sequence specificity of oncogenic kinases and autophosphorylated sites. Using the AROC as a proxy for the degree of sequence specificity, we compared several subsets of kinases and SH2 domains. (A) Serine/threonine (S/T) kinases exhibit stronger sequence specificity (higher AROC) than tyrosine (Y) kinases (P < 10−10). Tyrosine kinases with SH2 domains are less specific (lower AROC) than other tyrosine kinases (P < 10−3). (B) Oncogenic tyrosine kinases, as defined by the Cancer Genome Project (56), have lower AROC than their non-oncogenic counterparts (P < 0.003). Error bars show the 90% confidence intervals and statistical significance was tested by Student’s t test. (C) The score distribution of serine/threonine autophosphorylation sites in 10 kinases is shifted toward low values, whereas the random expectation would be a uniform distribution (P < 0.04; see Methods). This shows that autophosphorylation sites typically have weaker sequence motifs than other sites phosphorylated by the same kinase.
Fig. 6
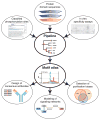
The role of NetPhorest in phosphoproteomics and modeling of phosphorylation-dependent signaling networks. The NetPhorest atlas of consensus linear motifs can be used for designing synthetic peptides for the development of kinase- or family-specific antibodies (for example, pS/T-Q), will replace Scansite (13) and NetPhosK (20) as the motif component of the NetworKIN resource (
) (12, 57), and can be used to detect biases arising from the enrichment procedures commonly used in phosphoproteomics [for example, phosphoramidate chemistry (PAC), immobilized metal affinity chromatography (IMAC), and titanium oxide (TiO2) (58)]. The NetPhorest Web site (
) provides the means to classify phosphorylation sites on the basis of consensus sequence motifs.
Similar articles
- Interaction between the phosphotyrosine binding domain of Shc and the insulin receptor is required for Shc phosphorylation by insulin in vivo.
Isakoff SJ, Yu YP, Su YC, Blaikie P, Yajnik V, Rose E, Weidner KM, Sachs M, Margolis B, Skolnik EY. Isakoff SJ, et al. J Biol Chem. 1996 Feb 23;271(8):3959-62. doi: 10.1074/jbc.271.8.3959. J Biol Chem. 1996. PMID: 8626723 - SH2 and PTB domains in tyrosine kinase signaling.
Schlessinger J, Lemmon MA. Schlessinger J, et al. Sci STKE. 2003 Jul 15;2003(191):RE12. doi: 10.1126/stke.2003.191.re12. Sci STKE. 2003. PMID: 12865499 Review. - Re-engineering the target specificity of the insulin receptor by modification of a PTB domain binding site.
van der Geer P, Wiley S, Pawson T. van der Geer P, et al. Oncogene. 1999 May 20;18(20):3071-5. doi: 10.1038/sj.onc.1202879. Oncogene. 1999. PMID: 10340378 - SH2 and PTB domain interactions in tyrosine kinase signal transduction.
Shoelson SE. Shoelson SE. Curr Opin Chem Biol. 1997 Aug;1(2):227-34. doi: 10.1016/s1367-5931(97)80014-2. Curr Opin Chem Biol. 1997. PMID: 9667855 Review.
Cited by
- New analysis pipeline for high-throughput domain-peptide affinity experiments improves SH2 interaction data.
Ronan T, Garnett R, Naegle KM. Ronan T, et al. J Biol Chem. 2020 Aug 7;295(32):11346-11363. doi: 10.1074/jbc.RA120.012503. Epub 2020 Jun 15. J Biol Chem. 2020. PMID: 32540967 Free PMC article. - Phosphoproteomics data classify hematological cancer cell lines according to tumor type and sensitivity to kinase inhibitors.
Casado P, Alcolea MP, Iorio F, Rodríguez-Prados JC, Vanhaesebroeck B, Saez-Rodriguez J, Joel S, Cutillas PR. Casado P, et al. Genome Biol. 2013 Apr 29;14(4):R37. doi: 10.1186/gb-2013-14-4-r37. Genome Biol. 2013. PMID: 23628362 Free PMC article. - VPS34-dependent control of apical membrane function of proximal tubule cells and nutrient recovery by the kidney.
Rinschen MM, Harder JL, Carter-Timofte ME, Zanon Rodriguez L, Mirabelli C, Demir F, Kurmasheva N, Ramakrishnan SK, Kunke M, Tan Y, Billing A, Dahlke E, Larionov AA, Bechtel-Walz W, Aukschun U, Grabbe M, Nielsen R, Christensen EI, Kretzler M, Huber TB, Wobus CE, Olagnier D, Siuzdak G, Grahammer F, Theilig F. Rinschen MM, et al. Sci Signal. 2022 Nov 29;15(762):eabo7940. doi: 10.1126/scisignal.abo7940. Epub 2022 Nov 29. Sci Signal. 2022. PMID: 36445937 Free PMC article. - Kinase-Catalyzed Crosslinking and Immunoprecipitation (K-CLIP) to Explore Kinase-Substrate Pairs.
Beltman RJ, Pflum MKH. Beltman RJ, et al. Curr Protoc. 2022 Sep;2(9):e539. doi: 10.1002/cpz1.539. Curr Protoc. 2022. PMID: 36135312 Free PMC article. - Structure of the CaMKIIdelta/calmodulin complex reveals the molecular mechanism of CaMKII kinase activation.
Rellos P, Pike AC, Niesen FH, Salah E, Lee WH, von Delft F, Knapp S. Rellos P, et al. PLoS Biol. 2010 Jul 27;8(7):e1000426. doi: 10.1371/journal.pbio.1000426. PLoS Biol. 2010. PMID: 20668654 Free PMC article.
References
- Yaffe MB. “Bits” and pieces. Sci STKE. 2006;2006:pe28. - PubMed
- Jensen LJ, Jensen TS, de Lichtenberg U, Brunak S, Bork P. Co-evolution of transcriptional and posttranslational cell-cycle regulation. Nature. 2006;443:594–597. - PubMed
Publication types
MeSH terms
Substances
Grants and funding
- WT_/Wellcome Trust/United Kingdom
- R01 GM060594/GM/NIGMS NIH HHS/United States
- U54 CA112967/CA/NCI NIH HHS/United States
- U54-CA112967/CA/NCI NIH HHS/United States
- R01 GM60594/GM/NIGMS NIH HHS/United States
LinkOut - more resources
Full Text Sources
Other Literature Sources
Molecular Biology Databases
Miscellaneous
