Synaptic and cellular properties of the feedforward inhibitory circuit within the input layer of the cerebellar cortex - PubMed (original) (raw)
Synaptic and cellular properties of the feedforward inhibitory circuit within the input layer of the cerebellar cortex
Roby T Kanichay et al. J Neurosci. 2008.
Abstract
Precise representation of the timing of sensory stimuli is essential for rapid motor coordination, a core function of the cerebellum. Feedforward inhibition has been implicated in precise temporal signaling in several regions of the brain, but little is known about this type of inhibitory circuit within the input layer of the cerebellar cortex. We investigated the synaptic properties of feedforward inhibition at near physiological temperatures (35 degrees C) in rat cerebellar slices. We establish that the previously uncharacterized mossy fiber-Golgi cell-granule cell pathway can act as a functional feedforward inhibitory circuit. The synchronous activation of four mossy fibers, releasing a total of six quanta onto a Golgi cell, can reset spontaneous Golgi cell firing with high temporal precision (200 mus). However, only modest increases in Golgi cell firing rate were observed during trains of high-frequency mossy fiber stimulation. This decoupling of Golgi cell activity from mossy fiber firing rate was attributable to a strong afterhyperpolarization after each action potential, preventing mossy fiber-Golgi cell signaling for approximately 50 ms. Feedforward excitation of Golgi cells induced a temporally precise inhibitory conductance in granule cells that curtailed the excitatory action of the mossy fiber EPSC. The synaptic and cellular properties of this feedforward circuit appear tuned to trigger a fast inhibitory conductance in granule cells at the onset of stimuli that produce intense bursts of activity in multiple mossy fibers, thereby conserving the temporal precision of the initial granule cell response.
Figures
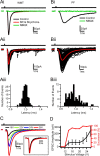
Figure 1.
Comparison of Golgi cell EPSCs evoked by white matter tract and parallel fiber stimulation. Ai, Mean EPSCs recorded at −60 mV in response to WMT stimulation in control, 10 μ
m
SR95531 (gabazine) and 0.3 μ
m
strychnine, and in 100 μ
m
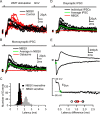
NBQX. Bar above indicates time of stimulation. Aii, Individual EPSCs in response to WMT stimulation (black); mean current trace in red. Arrow indicates long-latency disynaptic EPSCs. Aiii, Latency distribution histogram of evoked events shown in Aii (mean latency = 1.00 ± 0.07 ms). Bi–Biii, Same as Ai–Aiii but for PF-evoked EPSCs activated by electrical stimulation in the upper GrC layer. The mean latency was for this cell 1.0 ± 0.2 ms. C, Mean EPSC waveforms elicited at various WMT stimulation intensities. Higher stimulus voltages led to increased EPSC amplitudes. Inset, Normalized current waveform for 16 and 26 V. D, Relationships between mean peak amplitude and stimulus voltage and EPSC successes and stimulus voltage.
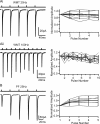
Figure 2.
Short-term plasticity of EPSCs evoked by white matter tract and parallel fiber stimulation. Ai, Left shows averaged EPSCs evoked with a five-pulse WMT stimulus with a 40 ms interval (25 Hz). Right shows normalized EPSC amplitudes for individual cells (dotted) and population mean (n = 14; solid line). The peak amplitudes of evoked events were normalized to the first peak. Aii, Same as Ai for 10 stimuli at 100 Hz. B, PF EPSCs evoked by GrC layer stimulation. Five pulses at 25 Hz as for Ai. Right shows normalized PF-EPSC amplitude for individual cells (dotted) and population mean (n = 6; solid line). Error bars denote SD.
Figure 3.
Calcium imaging of Golgi cells during white matter tract stimulation. A, Drawing of a Golgi cell reconstructed from a montage of fluorescent images acquired in various focal planes (examples are illustrated in B). The blue line indicates the border between the granular and molecular layer. B, Fluorescent images (1 focal plane) of the same Golgi cell loaded with the calcium indicator OGB1. C, Δ_F_/F (pseudocolor scale on right) was calculated for each pixel from images taken before, and during, 100 Hz WMT stimulation. D, WMT stimulation evoked EPSCs for same cell. Individual currents shown in black and mean in red. Current kinetics and latency distribution were indistinguishable from putative MF EPSCs described in Figure 1. E, EPSC amplitude, normalized to the first EPSC, during a 25 Hz, five-pulse WMT stimulation (individual cells indicated as dotted lines) from cells that exhibited Ca2+ signal on descending dendrites (n = 7). Error bars indicate SD. F, Dependence of mean EPSC rise time on distance between the center of the soma and location of the peak calcium change on the dendrite. Solid line shows linear regression (Pearson's r = 0.67; p < 0.05).
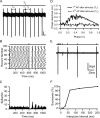
Figure 4.
Effect of mossy fiber input on spontaneous Golgi cell firing. A, Loose cell-attached voltage-clamp recording from a Golgi cell during single-shock MF stimulation. The bar above indicates time of MF stimulation. _T_0 indicates a representative ISI (equal to the mode) before stimulation, _T_1 the ISI between spikes before and after stimulation, and _T_2 the ISI between the first and second spike after stimulation. Ts denotes the interval between stimulation and preceding action potential. Calibration bars: 20 pA, 50 ms. B, Spike raster plot from same cell as A. Dots represent spike times measured at the 50% time point of the AP inward deflection. C, Peristimulus spike time histogram for same recording. The frequency of AP occurrences in a 1 ms bin after the stimulation was significantly increased above the prestimulus baseline (p < 0.0001, single-factor ANOVA). D, Phase reset curve averaged across 21 cells. Black solid curve shows phase of first AP after stimulation, and black broken graph shows behavior of the second AP as a function of the phase of stimulation. The datasets were significantly different (p < 0.0001, single-factor ANOVA), indicating that a phase reset was induced by stimulation. E, Averaged cell-attached recordings during a paired-pulse MF stimulation protocol. A conditioning MF stimulation pulse that triggered an AP was followed by a second test pulse at various time intervals. The reduction in current amplitude indicates increased failures in triggering an AP. F, Relationship between percentage of trials that resulted in an AP on the second pulse as a function of the interpulse interval for the cell in E.
Figure 5.
Precision and reliability of mossy fiber-evoked Golgi cell firing. A, MF-evoked APs recorded in LCA configuration at high temporal resolution. B, Spike latency histogram of APs during 1 Hz stimulation measured over a 3 ms window after the stimulus. C, Dependence of SD of AP times (precision) on AP probability for LCA recordings. Data points connected with lines show the AP precision at two different AP probabilities (stimulus intensities) for the same cell. Broken line indicates linear regression of all data points (Pearson's r = −0.14; p > 0.2). D, Spike raster plot showing Golgi cell firing in response to 10 Hz white matter tract stimulation. The distributions shown below illustrate the spike jitter for APs in response to the first and fifth stimulus (4 ms measurement window). E, Same as D for 100 Hz stimulation. F, Dependence of spike-time precision on stimulation frequency across cells. Spike-time precision deteriorates slightly but significantly with increasing input frequency (n = 5). G, Probability of generating MF-evoked spikes in Golgi cells during trains of five stimuli at 10 Hz (solid line) and 100 Hz (dashed line). H, Effect of MF stimulation frequency on Golgi cell mean firing rate. The moderate increase in firing rate was significant for stimulation frequencies ≥10 Hz (p < 0.05, pairwise t test).
Figure 6.
EPSP-spike coupling and efficacy of mossy fiber–Golgi cell transmission. A, Whole-cell current-clamp recordings from a Golgi cell exhibiting spontaneous rhythmic firing and pronounced afterhyperpolarization. The bar above indicates the timing of MF stimulation, which triggered an AP on one trial (red) but failed to cross threshold on the other (black). The stimulus intensity was set to give a 50% AP probability, which was determined in a previous LCA recording of the same cell. B, Membrane voltage during a 500 μs time window before the synaptic event. When MF EPSPs occurred late in the spike cycle at depolarized membrane potentials, they tended to trigger APs (red), but when membrane voltage was hyperpolarized, EPSPs remained subthreshold (black). C, Top, MF-evoked APs (red) and subthreshold EPSPs (black) for same cell on expanded scale. Bottom, Overlay of peak normalized spike latency histogram measured over 5 ms time window after the stimulus (red) and corresponding mean subthreshold EPSP (black) from the same cell. Latency was measured as the time between the stimulus and threshold crossing. The population mean EPSC waveform (dashed green line; 9 cells recorded with a different amplifier) (see Materials and Methods) was aligned to the foot of the uncompensated EPSC recorded in this cell. The fact that the peak of the EPSC and maximum rate of rise of the EPSP occur at the same time suggests that this alignment is correct. D, Dependence of EPSC amplitude on preceding membrane potential for subthreshold EPSPs. A linear regression was only fit to EPSP measurements with preceding potentials below −72 mV (black points) to avoid the sampling bias caused by the loss of EPSPs that generated APs from the population. The remaining EPSP measurements are shown in gray. E, Average amplitudes of mossy fiber EPSCs recorded at stimulus voltages that evoked APs (eAP) with 50% probability and EPSC amplitudes evoked with minimal stimulation (min) in the same cells.
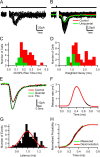
Figure 7.
Release time course and quantal content at mossy fiber–Golgi cell synapses. A, Quantal currents and release failures in response to single mossy fiber (MF) stimulation under low release probability conditions (1 m
m
Ca2+ and 5 m
m
Mg2+). B, Individual MF EPSCs evoked under control conditions (2 m
m
Ca2+ and 1 m
m
Mg2+; black), the average current including failures (red) together with the average uniquantal current (green). C, Rise time (20–80%) distribution of mean uniquantal (green) and single fiber-evoked control currents (red) across cells. D, Same as C for weighted decay times. E, Mean quantal waveform obtained from averaging 20% rise time-aligned uniquantal events under low release probability conditions (green) with stimulus-aligned mean EPSC waveform under control conditions (red) for the same cell. The broken lines indicate fits used for deconvolution analysis. F, Vesicular release function obtained by deconvolution. The black segment represents a 100 μs time window at the peak of the mean EPSC. G, Latency distribution of uniquantal events recorded under low release probability conditions. The red line shows a fit with Gaussian function (SD of 110 μs). H, Comparison of cumulative release probability functions obtained by deconvolution and direct measurement.
Figure 8.
Feedforward inhibition of granule cells. A, IPSCs recorded in a GrC at 0 mV during WMT (100 V for 20 μs) stimulation in control conditions (red) and in the presence of 10 μ
m
NBQX (black). B, Monosynaptic IPSCs in the presence of NBQX (black), the average IPSC (green), and its block by 10 μ
m
gabazine (red). C, Latency distribution of NBQX-sensitive (gray) and -insensitive IPSC (black bars) pooled across cells. Red broken line indicates latency criterion used to distinguish GrCs receiving disynaptic inhibition. D, Group of long-latency IPSCs (in black) in response to WMT stimulation with average current (in green). IPSCs were fully blocked by 10 μ
m
NBQX (red). E, Top, Average disynaptic inhibitory conductance (IPSG) recorded at 0 mV and average monosynaptic MF–GrC excitatory conductance (EPSG) recorded at −70 mV in the same cell at same stimulus intensity. Green circle indicates 20% rise time point of EPSG. Middle, Time course of calculated synaptic reversal potential (_E_Syn indicates reversal potential of the combined excitatory and inhibitory conductances), with the broken line indicating the spike threshold (Cathala et al., 2003). Green circle shows crossing of synaptic reversal potential with spike threshold (−40 mV), indicating a net inhibitory effect of the total synaptic conductance from that time point onward. Bottom, Latency difference between 20% rise time point of the EPSG and starting point of the net inhibitory effect for six cells. Mean value with SD is shown in red.
Similar articles
- Synchronization of golgi and granule cell firing in a detailed network model of the cerebellar granule cell layer.
Maex R, De Schutter E. Maex R, et al. J Neurophysiol. 1998 Nov;80(5):2521-37. doi: 10.1152/jn.1998.80.5.2521. J Neurophysiol. 1998. PMID: 9819260 - Dynamics of fast and slow inhibition from cerebellar golgi cells allow flexible control of synaptic integration.
Crowley JJ, Fioravante D, Regehr WG. Crowley JJ, et al. Neuron. 2009 Sep 24;63(6):843-53. doi: 10.1016/j.neuron.2009.09.004. Neuron. 2009. PMID: 19778512 Free PMC article. - Synaptic integration in a model of cerebellar granule cells.
Gabbiani F, Midtgaard J, Knöpfel T. Gabbiani F, et al. J Neurophysiol. 1994 Aug;72(2):999-1009. doi: 10.1152/jn.1994.72.2.999. J Neurophysiol. 1994. PMID: 7527078 - The unipolar brush cell: a remarkable neuron finally receiving deserved attention.
Mugnaini E, Sekerková G, Martina M. Mugnaini E, et al. Brain Res Rev. 2011 Jan 7;66(1-2):220-45. doi: 10.1016/j.brainresrev.2010.10.001. Epub 2010 Nov 5. Brain Res Rev. 2011. PMID: 20937306 Free PMC article. Review. - The cerebellar Golgi cell and spatiotemporal organization of granular layer activity.
D'Angelo E, Solinas S, Mapelli J, Gandolfi D, Mapelli L, Prestori F. D'Angelo E, et al. Front Neural Circuits. 2013 May 17;7:93. doi: 10.3389/fncir.2013.00093. eCollection 2013. Front Neural Circuits. 2013. PMID: 23730271 Free PMC article. Review.
Cited by
- Identification of an inhibitory circuit that regulates cerebellar Golgi cell activity.
Hull C, Regehr WG. Hull C, et al. Neuron. 2012 Jan 12;73(1):149-58. doi: 10.1016/j.neuron.2011.10.030. Neuron. 2012. PMID: 22243753 Free PMC article. - Towards the Simulation of a Realistic Large-Scale Spiking Network on a Desktop Multi-GPU System.
Torti E, Florimbi G, Dorici A, Danese G, Leporati F. Torti E, et al. Bioengineering (Basel). 2022 Oct 11;9(10):543. doi: 10.3390/bioengineering9100543. Bioengineering (Basel). 2022. PMID: 36290510 Free PMC article. - Long-term depression at parallel fiber to Golgi cell synapses.
Robberechts Q, Wijnants M, Giugliano M, De Schutter E. Robberechts Q, et al. J Neurophysiol. 2010 Dec;104(6):3413-23. doi: 10.1152/jn.00030.2010. Epub 2010 Sep 22. J Neurophysiol. 2010. PMID: 20861429 Free PMC article. - Serotonin regulates dynamics of cerebellar granule cell activity by modulating tonic inhibition.
Fleming E, Hull C. Fleming E, et al. J Neurophysiol. 2019 Jan 1;121(1):105-114. doi: 10.1152/jn.00492.2018. Epub 2018 Oct 3. J Neurophysiol. 2019. PMID: 30281395 Free PMC article. - Candelabrum cells are ubiquitous cerebellar cortex interneurons with specialized circuit properties.
Osorno T, Rudolph S, Nguyen T, Kozareva V, Nadaf NM, Norton A, Macosko EZ, Lee WA, Regehr WG. Osorno T, et al. Nat Neurosci. 2022 Jun;25(6):702-713. doi: 10.1038/s41593-022-01057-x. Epub 2022 May 16. Nat Neurosci. 2022. PMID: 35578131 Free PMC article.
References
Publication types
MeSH terms
Substances
Grants and funding
- G0400598/WT_/Wellcome Trust/United Kingdom
- 064413/WT_/Wellcome Trust/United Kingdom
- G0400598(71261)/MRC_/Medical Research Council/United Kingdom
- WT_/Wellcome Trust/United Kingdom
- G0400598/MRC_/Medical Research Council/United Kingdom
LinkOut - more resources
Full Text Sources
