Genome-wide association of histone H3 lysine nine methylation with CHG DNA methylation in Arabidopsis thaliana - PubMed (original) (raw)
Genome-wide association of histone H3 lysine nine methylation with CHG DNA methylation in Arabidopsis thaliana
Yana V Bernatavichute et al. PLoS One. 2008.
Abstract
Methylation of histone H3 lysine 9 (H3K9) is a hallmark of transcriptional silencing in many organisms. In Arabidopsis thaliana, dimethylation of H3K9 (H3K9m2) is important in the silencing of transposons and in the control of DNA methylation. We constructed a high-resolution genome-wide map of H3K9m2 methylation by using chromatin immunoprecipitation coupled with whole genome Roche Nimblegen microarrays (ChIP-chip). We observed a very high coincidence between H3K9m2 and CHG methylation (where H is either A,T or C) throughout the genome. The coding regions of genes that are associated exclusively with methylation in a CG context did not contain H3K9m2. In addition, we observed two distinct patterns of H3K9m2. Transposons and other repeat elements present in the euchromatic arms contained small islands of H3K9m2 present at relatively low levels. In contrast, pericentromeric/centromeric regions of Arabidopsis chromosomes contained long, rarely interrupted blocks of H3K9m2 present at much higher average levels than seen in the chromosome arms. These results suggest a complex interplay between H3K9m2 and different types of DNA methylation and suggest that distinct mechanisms control H3K9m2 in different compartments of the genome.
Conflict of interest statement
Competing Interests: The authors have declared that no competing interests exist.
Figures
Figure 1. Distribution of DNA methylation and K9H3m2 methylation along chromosomes.
Top panels show average DNA methylation levels in a sliding 100 kb window . Bottom panels show the number of H3K9m2 positive probes (z-score>0.2) in a sliding 100 kb window.
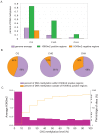
Figure 2. Correlation of H3K9m2 methylation with CHG DNA methylation.
(a) Average DNA methylation levels genome wide (purple), in H3K9m2 positive regions (Z score>1, green) and in H3K9m2 negative regions (Z-score<0, orange). (b) Percent of CG, CHG and CHH methylation falling within H3K9m2 positive regions. (c) Correlation of the percentage of CHG methylation at individual sites throughout the genome with H3K9m2 levels. The x-axis is divided onto 10 individual bins that represent deciles of the percentage of CHG methylation of all CHG sites in the genome. Purple bars represent the percentage of CHG sites that fall with each methylation decile (right logarithmic axis), and orange line represents the average H3K9m2 level (Z-score) (left axis).
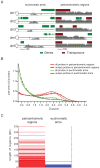
Figure 3. Relationship between H3K9m2 levels and the length of H3K9m2 positive regions in different chromosomal compartments.
(a) Examples of typical H3K9m2 levels present in either euchromatic chromosomal arms or pericentromeric regions. Each gray bar corresponds to the Z-score of an individual probe. (b) Distribution of z-scores in the euchromatic arms (green) and pericentromeric regions (red). (c) Lengths of uninterrupted H3K9m2 methylated regions, with each horizontal bar representing a single region in either the euchromatic arms or pericentromeric regions.
Figure 4. The percentage of DNA methylation increases as the length of H3K9m2 positive regions increases.
Average percent DNA methylation of CG (red), CHG (green) and CHH (blue) was calculated for H3K9m2 positive regions of different lengths.
Figure 5. H3K9m2 methylation and expression levels of genes.
(a) Histogram of H3K9m2 methylation of genes present in euchromatic arms (red line) or present in pericentromeric regions (blue bars). X-axis corresponds to average Z-score of each gene and Y-axis is the percent of the genes falling within each Z-score interval. (b) Expression level of all genes located in pericentromeric regions (green), those that are H3K9m2 methylated (red) or are unmethylated (blue).
Figure 6. H3K9m2 methylation of transposable elements.
The majority of transposons in pericentromeric regions have high levels of H3K9m2 (blue bars), while a large number of transposons in the arms are unmethylated (red line). X axis represents the average H3K9m2 level (Z-score) for the element and Y axis represents the percentage of elements falling into each category.
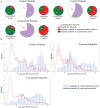
Figure 7. H3K9m2 of various repeat elements in the Arabidopsis genome.
(a) Percent of H3K9m2 methylated (purple) and unmethylated repeats (white). The majority of unmethylated repeats are present in euchromatic arms (green), while the majority of methylated repeats are located in pericentromeric regions (red). (b) Average H3K9m2 levels across tandem, inverted and interspersed repeats present in different genome compartments. All three kinds of repeats are more frequently methylated and have higher average H3K9m2 levels when they reside in pericentromeric regions. X axis represents the average H3K9m2 level (Z-score) for the element and Y axis represents the percentage of elements falling into each category.
Figure 8. H3K9m2 methylation of siRNA clusters.
Graph shows the percentage of different categories of siRNA clusters (dense, medium, or sparse) that overlap with H3K9m2 positive regions in either pericentromeric regions (orange) or arms (purple).
Similar articles
- Loss of the DNA methyltransferase MET1 Induces H3K9 hypermethylation at PcG target genes and redistribution of H3K27 trimethylation to transposons in Arabidopsis thaliana.
Deleris A, Stroud H, Bernatavichute Y, Johnson E, Klein G, Schubert D, Jacobsen SE. Deleris A, et al. PLoS Genet. 2012;8(11):e1003062. doi: 10.1371/journal.pgen.1003062. Epub 2012 Nov 29. PLoS Genet. 2012. PMID: 23209430 Free PMC article. - Histone H1 prevents non-CG methylation-mediated small RNA biogenesis in Arabidopsis heterochromatin.
Choi J, Lyons DB, Zilberman D. Choi J, et al. Elife. 2021 Dec 1;10:e72676. doi: 10.7554/eLife.72676. Elife. 2021. PMID: 34850679 Free PMC article. - Genomic distribution of H3K9me2 and DNA methylation in a maize genome.
West PT, Li Q, Ji L, Eichten SR, Song J, Vaughn MW, Schmitz RJ, Springer NM. West PT, et al. PLoS One. 2014 Aug 14;9(8):e105267. doi: 10.1371/journal.pone.0105267. eCollection 2014. PLoS One. 2014. PMID: 25122127 Free PMC article. - Chromatin-based silencing mechanisms.
Bender J. Bender J. Curr Opin Plant Biol. 2004 Oct;7(5):521-6. doi: 10.1016/j.pbi.2004.07.003. Curr Opin Plant Biol. 2004. PMID: 15337094 Review. - Silencing of transposons in plant genomes: kick them when they're down.
Zilberman D, Henikoff S. Zilberman D, et al. Genome Biol. 2004;5(12):249. doi: 10.1186/gb-2004-5-12-249. Epub 2004 Nov 16. Genome Biol. 2004. PMID: 15575975 Free PMC article. Review.
Cited by
- PTGS is dispensable for the initiation of epigenetic silencing of an active transposon in Arabidopsis.
Trasser M, Bohl-Viallefond G, Barragán-Borrero V, Diezma-Navas L, Loncsek L, Nordborg M, Marí-Ordóñez A. Trasser M, et al. EMBO Rep. 2024 Dec;25(12):5780-5809. doi: 10.1038/s44319-024-00304-5. Epub 2024 Nov 7. EMBO Rep. 2024. PMID: 39511423 Free PMC article. - Dynamic evolution of the heterochromatin sensing histone demethylase IBM1.
Zhang Y, Jang H, Luo Z, Dong Y, Xu Y, Kantamneni Y, Schmitz RJ. Zhang Y, et al. PLoS Genet. 2024 Jul 11;20(7):e1011358. doi: 10.1371/journal.pgen.1011358. eCollection 2024 Jul. PLoS Genet. 2024. PMID: 38991029 Free PMC article. - Recent Advances in Studies of Genomic DNA Methylation and Its Involvement in Regulating Drought Stress Response in Crops.
Fan Y, Sun C, Yan K, Li P, Hein I, Gilroy EM, Kear P, Bi Z, Yao P, Liu Z, Liu Y, Bai J. Fan Y, et al. Plants (Basel). 2024 May 17;13(10):1400. doi: 10.3390/plants13101400. Plants (Basel). 2024. PMID: 38794470 Free PMC article. Review. - A review of the potential involvement of small RNAs in transgenerational abiotic stress memory in plants.
Junaid MD, Chaudhry UK, Şanlı BA, Gökçe AF, Öztürk ZN. Junaid MD, et al. Funct Integr Genomics. 2024 Apr 11;24(2):74. doi: 10.1007/s10142-024-01354-7. Funct Integr Genomics. 2024. PMID: 38600306 Review. - Chromatin sensing: integration of environmental signals to reprogram plant development through chromatin regulators.
Wang W, Sung S. Wang W, et al. J Exp Bot. 2024 Jul 23;75(14):4332-4345. doi: 10.1093/jxb/erae086. J Exp Bot. 2024. PMID: 38436409 Review.
References
- Kouzarides T. Chromatin modifications and their function. Cell. 2007;128:693–705. - PubMed
- Peters AH, O'Carroll D, Scherthan H, Mechtler K, Sauer S, et al. Loss of the suv39h histone methyltransferases impairs mammalian heterochromatin and genome stability. Cell. 2001;107:323–337. - PubMed
- Lehnertz B, Ueda Y, Derijck AA, Braunschweig U, Perez-Burgos L, et al. Suv39h-mediated histone H3 lysine 9 methylation directs DNA methylation to major satellite repeats at pericentric heterochromatin. Curr Biol. 2003;13:1192–1200. - PubMed
- Tachibana M, Sugimoto K, Fukushima T, Shinkai Y. Set domain-containing protein, G9a, is a novel lysine-preferring mammalian histone methyltransferase with hyperactivity and specific selectivity to lysines 9 and 27 of histone H3. J Biol Chem. 2001;276:25309–25317. - PubMed
Publication types
MeSH terms
Substances
Grants and funding
- R37 GM060398/GM/NIGMS NIH HHS/United States
- HHMI/Howard Hughes Medical Institute/United States
- T32 GM007104/GM/NIGMS NIH HHS/United States
- R01 GM060398/GM/NIGMS NIH HHS/United States
- GM60398/GM/NIGMS NIH HHS/United States
LinkOut - more resources
Full Text Sources
Other Literature Sources


